
IoT data pipeline: LavinMQ to Prometheus to Grafana

Building an Internet of Things (IoT) monitoring system often requires an architecture capable of handling a lot of connections and bursts of data. Luckily, this is highly achievable—especially if you know where to start.
In this Docker Compose guide, we’ll use LavinMQ, Prometheus, and Grafana to break down an open-source data pipeline. This setup ingests sensor data via MQTT using LavinMQ, stores it in Prometheus, and transforms it into a real-time dashboard with Grafana. This foundation is designed to support the addition of thousands of sensors and easily handle increased data volume as you scale.
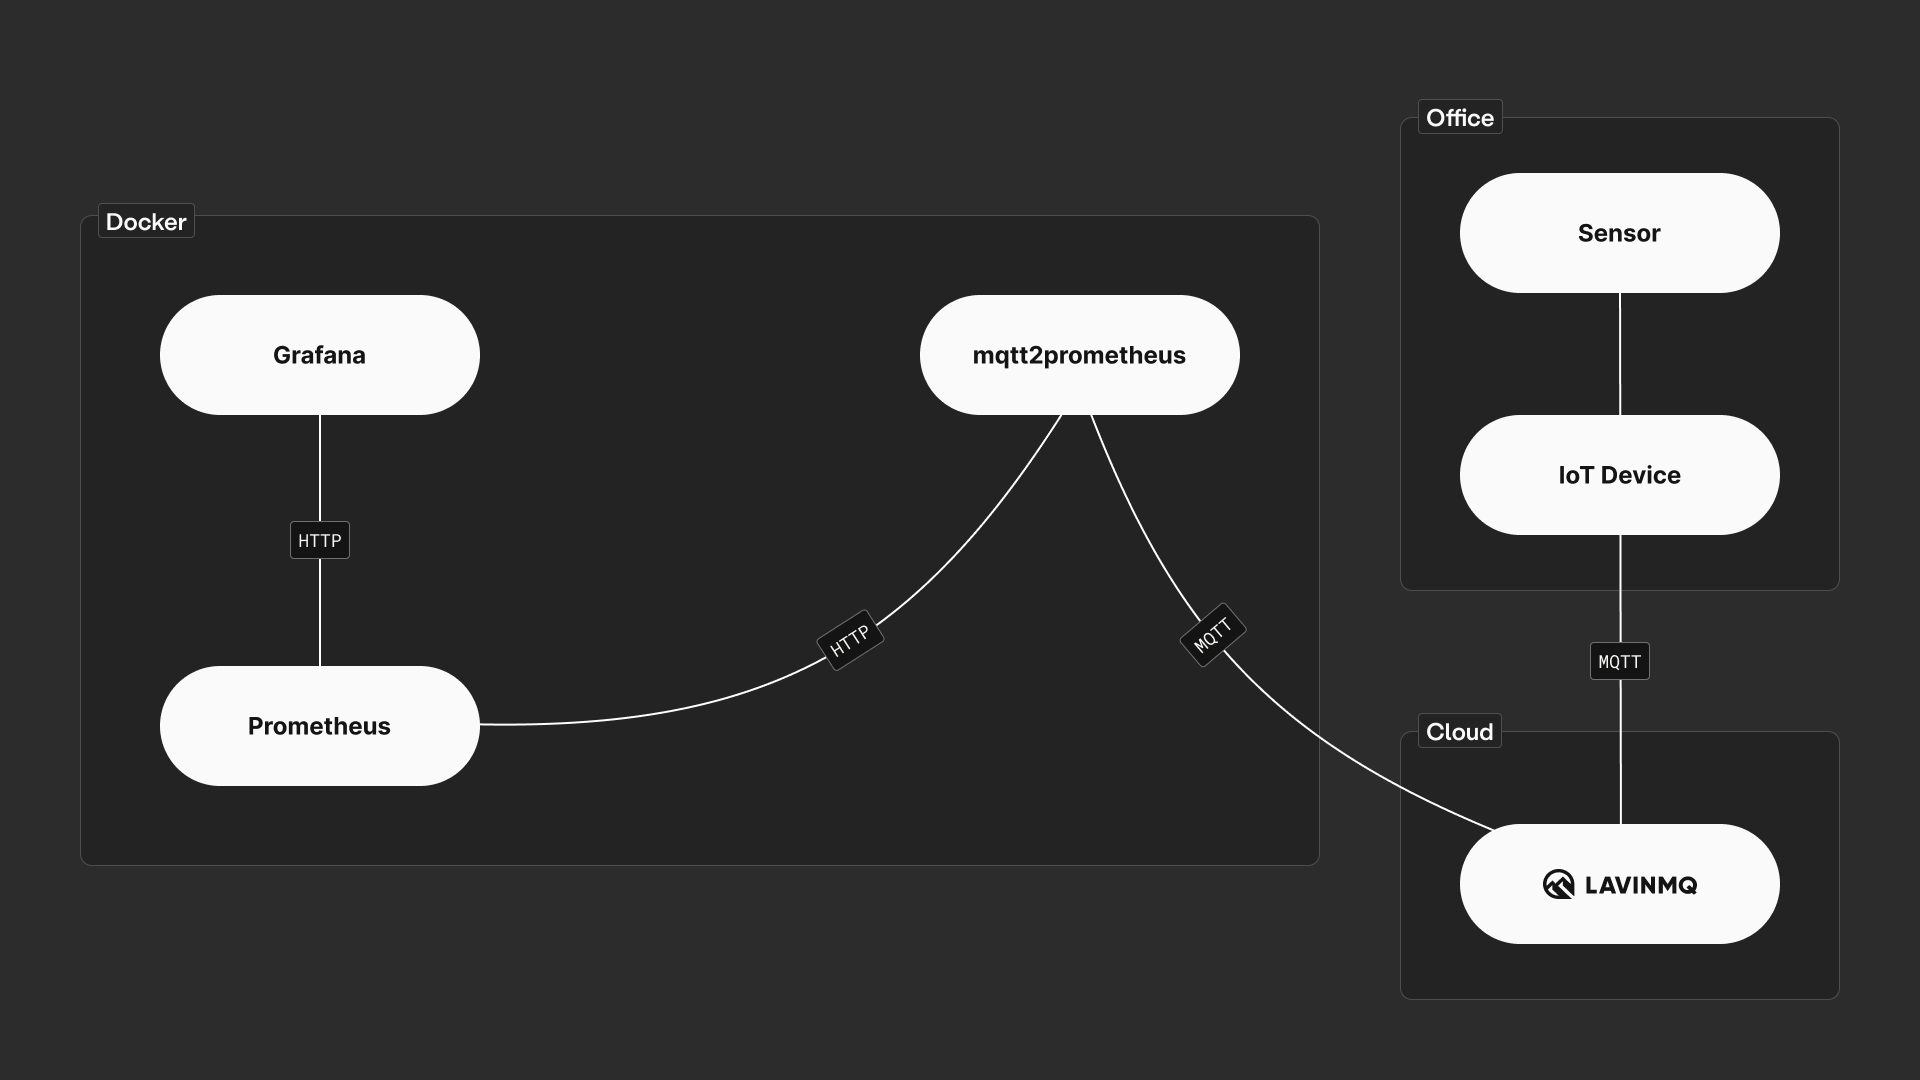
As shown in the picture above, the architecture is split into three main environments: the Office (devices), the Cloud (LavinMQ), and Docker (monitoring services).
- A Sensor feeds data to an IoT Device, which then sends that data via the MQTT protocol to the Cloud (LavinMQ).
- The data is received by LavinMQ. A service named
mqtt2prometheusconnects to LavinMQ and receives the data. This service converts the MQTT messages into a format suitable for time-series storage. Prometheus then pulls the data from the service over HTTP — a pull-based mechanism for which Prometheus is well known. - Grafana connects to Prometheus via HTTP to retrieve the stored time-series data, which is used to create dashboards.
| Component | Role in the pipeline | Protocol |
|---|---|---|
| IoT Device (Audrino + Sensor) | Reads raw data (Temp/Humidity) and publishes it to LavinMQ. | Analog (in) MQTT (out) |
| LavinMQ | A lightweight and fast message broker that receives and queues the sensor data. | MQTT |
mqtt2prometheus |
A bridge that subscribes to LavinMQ, converts the JSON messages into Prometheus metrics, and exposes them via an HTTP endpoint. | MQTT (In) / HTTP (Out) |
| Prometheus | A time-series database that actively scrapes the mqtt2prometheus bridge for new metrics. |
HTTP |
| Grafana | The visualization layer that queries the data from Prometheus to display real-time, historical charts and dashboards. | HTTP |
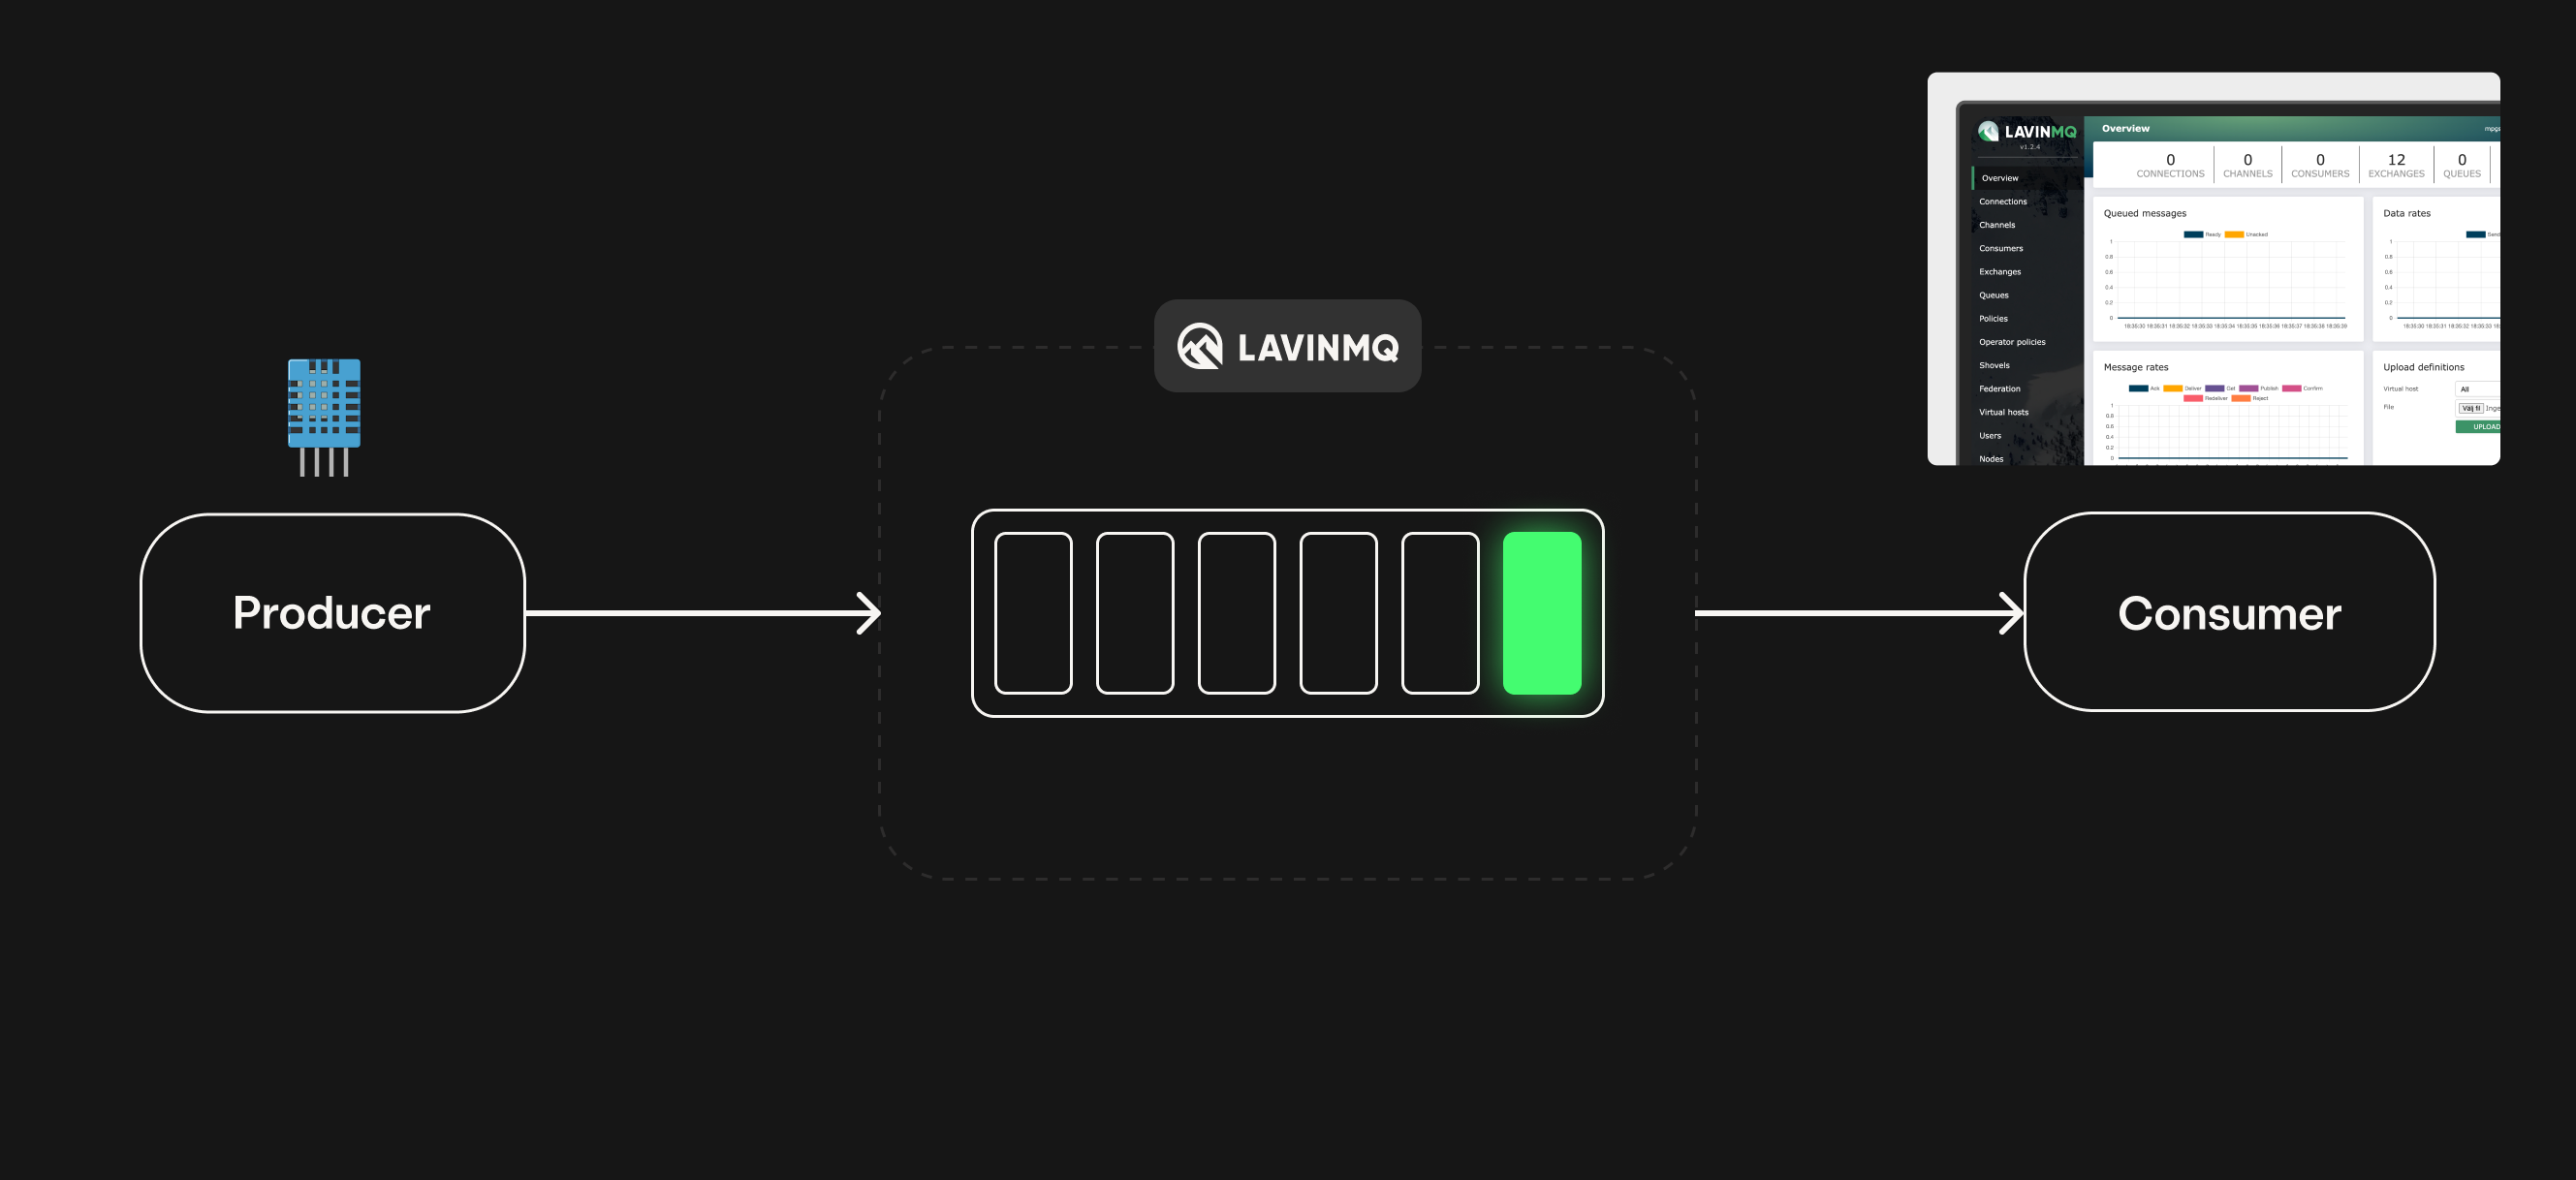
The architecture is based on the publish/subscribe messaging model. Here, the Publisher (the IoT device) sends data to the message broker, LavinMQ, and the Consumer (the data processing service) subscribes to and receives that data.
The core role of LavinMQ in this design is to decouple the data source from the destination. This means that if downstream components like Prometheus or Grafana temporarily go offline, the IoT device can continue sending data, confident that LavinMQ is buffering and storing the messages until the consumers reconnect and are ready to process them.
Step-by-step implementation summary
The implementation consists of three phases: the IoT device setup and LavinMQ connections, the backend services deployment via Docker, and the final Grafana dashboard configuration.
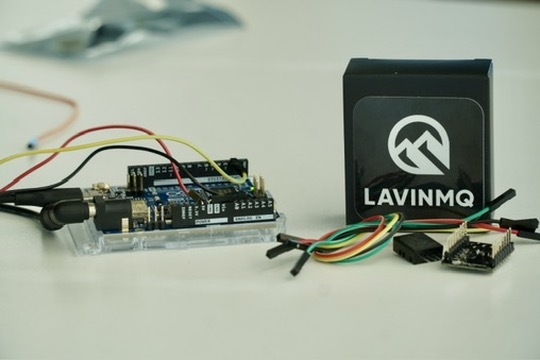
1. The IoT device and LavinMQ connection
The IoT device handles data acquisition and acts as our Publisher. The sensor senses temperature and humidity, while the board reads the data from the sensor and publishes it to LavinMQ. This data is structured into a JSON payload, e.g., {"temperature": 23.1, "humidity": 31.5}).
The device connects to the LavinMQ instance using the MQTT protocol. The device publishes the payload to a unique, structured MQTT topic path, such as /<vhost>/IoT/<device_ID> (/iot/skellefte-device-abc123). This topic structure is used in the upcoming step for the consumer.
-
Set up the IoT device: How to set up an ESP32-C6 board with a DHT11 temperature and humidity sensor is described in Real-time temperature monitoring with LavinMQ.
- Set up LavinMQ: How to set up a LavinMQ account in the cloud is described in step 2 of the blog Real-time temperature monitoring with LavinMQ.
-
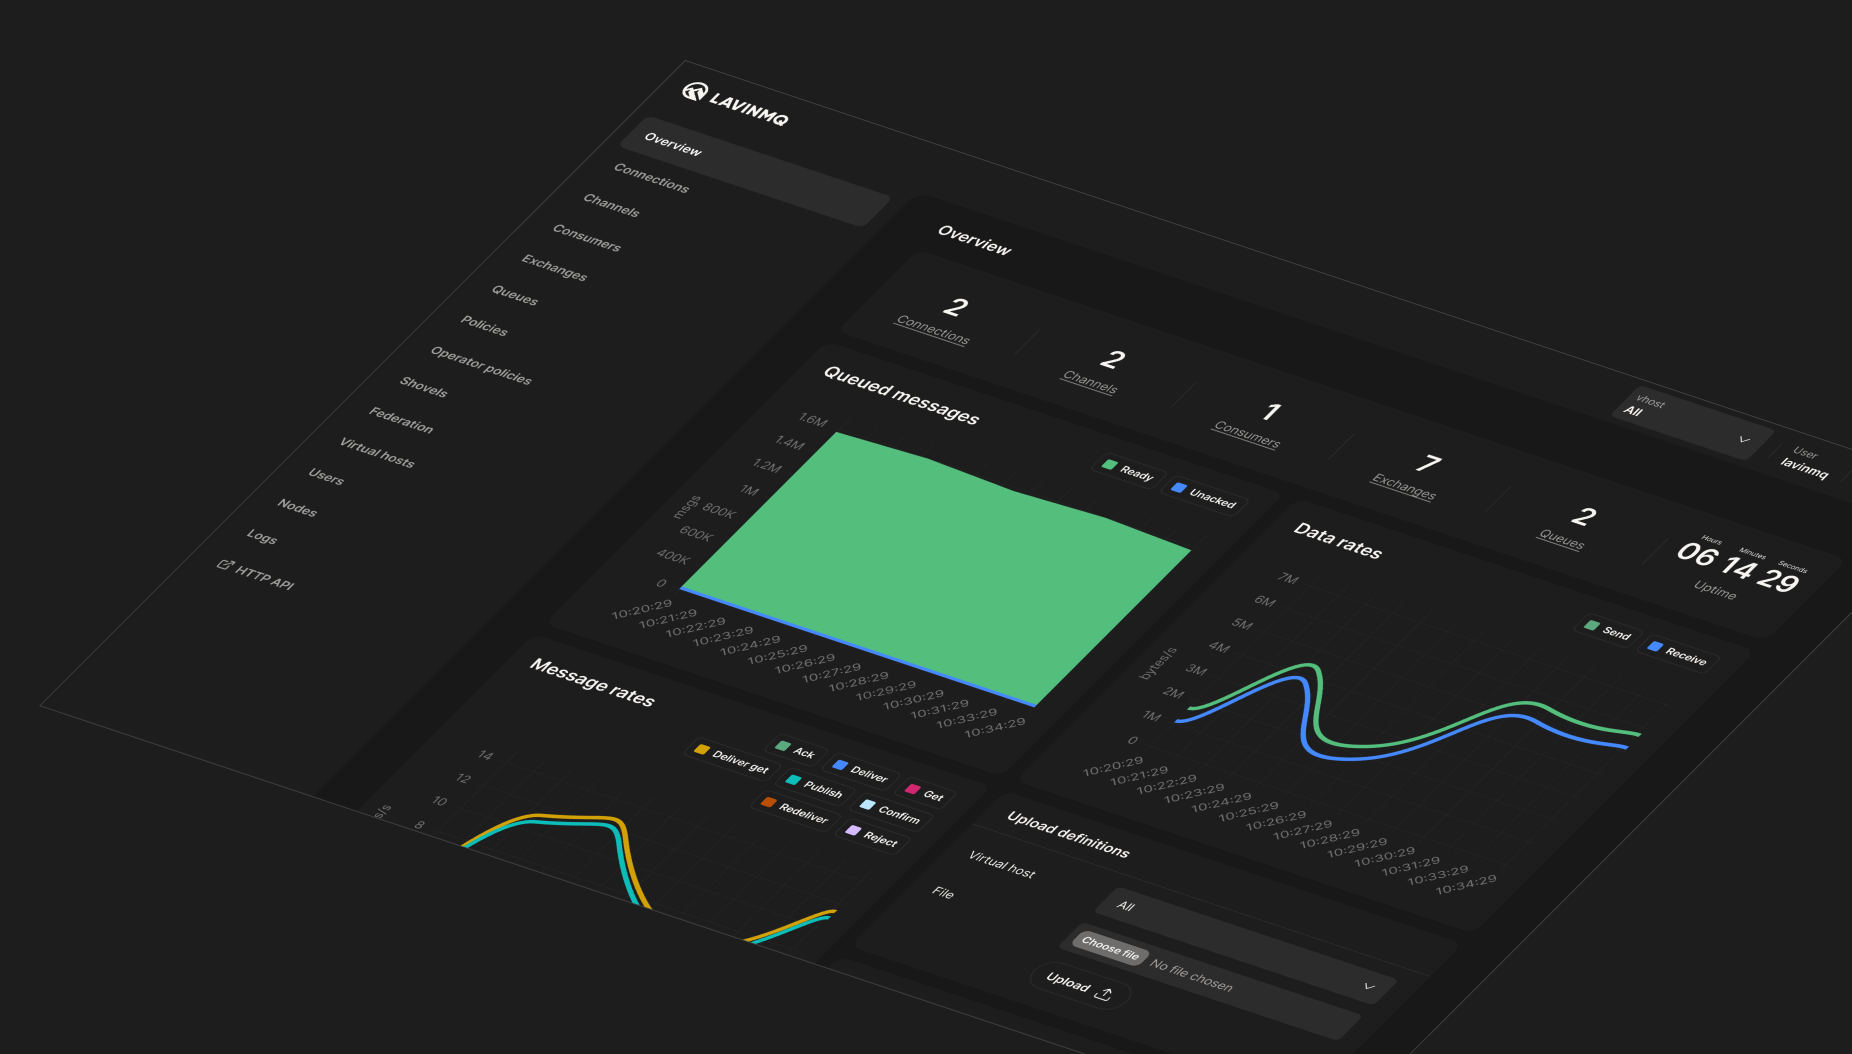
Send your first message to LavinMQ. When the device successfully connects, the LavinMQ management interface shows a new connection and an active message rate.
2. Deploying the backend with Docker Compose
The monitoring stack (mqtt2prometheus, Prometheus, and Grafana) is in this blog containerized and deployed together using Docker Compose for simple service discovery and networking.
A. docker-compose.yml
This file defines the three services and ensures they share a common network, allowing them to communicate using their service names (e.g., prometheus, mqtt2prometheus).
B. mqtt2prometheus Configuration
This service needs to be explicitly configured to understand how to talk to LavinMQ and how to interpret the incoming JSON:
- LavinMQ server details: It requires the host, port, credentials, and vhost to establish an MQTT client connection to LavinMQ.
- Topic subscription: It is configured to subscribe to the IoT topic path defined by the sensor (e.g.,
/iot/*). - JSON parsing: Maps the fields inside the JSON payload to Prometheus metrics. For instance, the JSON field
"temperature"is mapped to a metric namedtemperature.
C. Prometheus configuration
Prometheus needs a scrape job defined to fetch the metrics from the bridge:
YAML
	scrape_configs:
		job_name: 'weather-devices'
		static_configs:
		targets: ['m2p:9641'] # Targets the bridge service
Prometheus uses the service name (mqtt2prometheus) to find the bridge, scrapes the exposed metrics, and stores them in its time-series database. When checked, the Prometheus Targets page confirms the weather-devices job is up.
3. Creating the Grafana dashboard
Once Prometheus is storing the data, Grafana can be used to visualize it.

- Log in to Grafana: Use the default
admin/admincredentials (and ideally, update them). - Add Prometheus data source: Configure Prometheus as a data source using its service name and default port (
http://prometheus:9090). - Build panels (Temperature example):
- Create a new Time Series panel.
- Select Prometheus as the data source.
- Enter the metric name (e.g.,
temperature). Prometheus returns the stored time-series data. - Refine the visualization:
- Change the panel title to “Temperature“.
- Adjust the time range (e.g., last 15 minutes).
- In the Legend options, use `` to display a clean device identifier.
- Set the Unit to Celsius (°C).
- Repeat for Other Metrics: Duplicate the panel for Humidity and e.g. Heat Index.
- For the Humidity panel, change the query to
humidityand set the Unit to Misc / Percent (0–100), ensuring the Min/Max axis values are set to 0 and 100 for proper scaling.
- For the Humidity panel, change the query to
By following these steps, you achieve a live, reliable, and scalable real-time IoT monitoring dashboard ready for production deployment.
Ready to build your own IoT pipeline?
Readme, source code, and Docker compose setup can be found here: https://github.com/84codes/iot-lavinmq-caroline.
👉 A guide for setting up LavinMQ for independent use can be found in the LavinMQ installation guide or try a free LavinMQ instance on CloudAMQP and have your first dashboard running in minutes.
Questions about implementing this pipeline? Join our community or reach out to our team — we’re here to help! Join Slack!
Enjoyed this article?
Join our newsletter today to get exclusive updates, in-depth technical guides, and early access to our future plans, delivered straight to your inbox.
Lovisa Johansson