
Management Interface
The LavinMQ Management interface is a user-friendly dashboard to monitor and handle the LavinMQ broker from a web browser. Elements such as queues, connections, channels, exchanges, users, and user permissions can be created, deleted, and listed in the browser. Other tasks include monitoring the message rate and keeping track of the number of messages in the queues. This documentation describes the functions of the LavinMQ Management Interface.
Note: The columns view can be changed by clicking the +/- symbol in the top right corner. Many columns can be sorted with the arrows next to the column name as well as filtered through the name in the top left corner.
What is the LavinMQ Management Interface?
The LavinMQ Management Interface is a user-friendly interface to monitor and manage an LavinMQ broker from a web browser.
What are the benefits of using the LavinMQ Management Interface?
The LavinMQ Management Interface gives a quick and easy snapshot of the state of an LavinMQ broker.
How do I access the LavinMQ Management Interface?
The LavinMQ Management Interface can be accessed using a Web browser at
http://localhost:15672 if running it locally,
or https://{hostname}.lmq.cloudamqp.com if hosted by CloudAMQP.
Default Credentials
The default credentials for accessing the LavinMQ Management Interface are:
- Username:
guest - Password:
guest
Remote Access for Guest User
By default, the default (guest) user is restricted from accessing the server from a remote host. If you want the default user to access the server remotely, follow these steps:
- Command Line Option: Set the flag
--default-user-only-loopback=falsewhen starting LavinMQ from the command line. - Configuration File: Alternatively, you can incorporate the flag into the configuration file (
lavinmq.ini) by settingdefault_user_only_loopback = false.´
It’s important to note that the default user has full access to the server. Exposing the default user to the internet can pose a security risk. It’s recommended to create a user with limited permissions for remote access to mitigate potential security issues.
Theme Selection
The management interface supports both dark and light themes. Toggle between themes using the theme selector in the interface header. Your preference is saved locally and persists across sessions.
LavinMQ Management Interface Overview Tab
The Overview tab shows a quick and easy snapshot of the LavinMQ state. From the top right corner, you can choose to view metrics for all vhosts, or a specific one. This is also the location to view your user login name and to logout. The LavinMQ version is found in the top left corner next to the LavinMQ logo. When a certain vhost is specified in the top right, note that the tab will show different information depending on which vhost is selected.
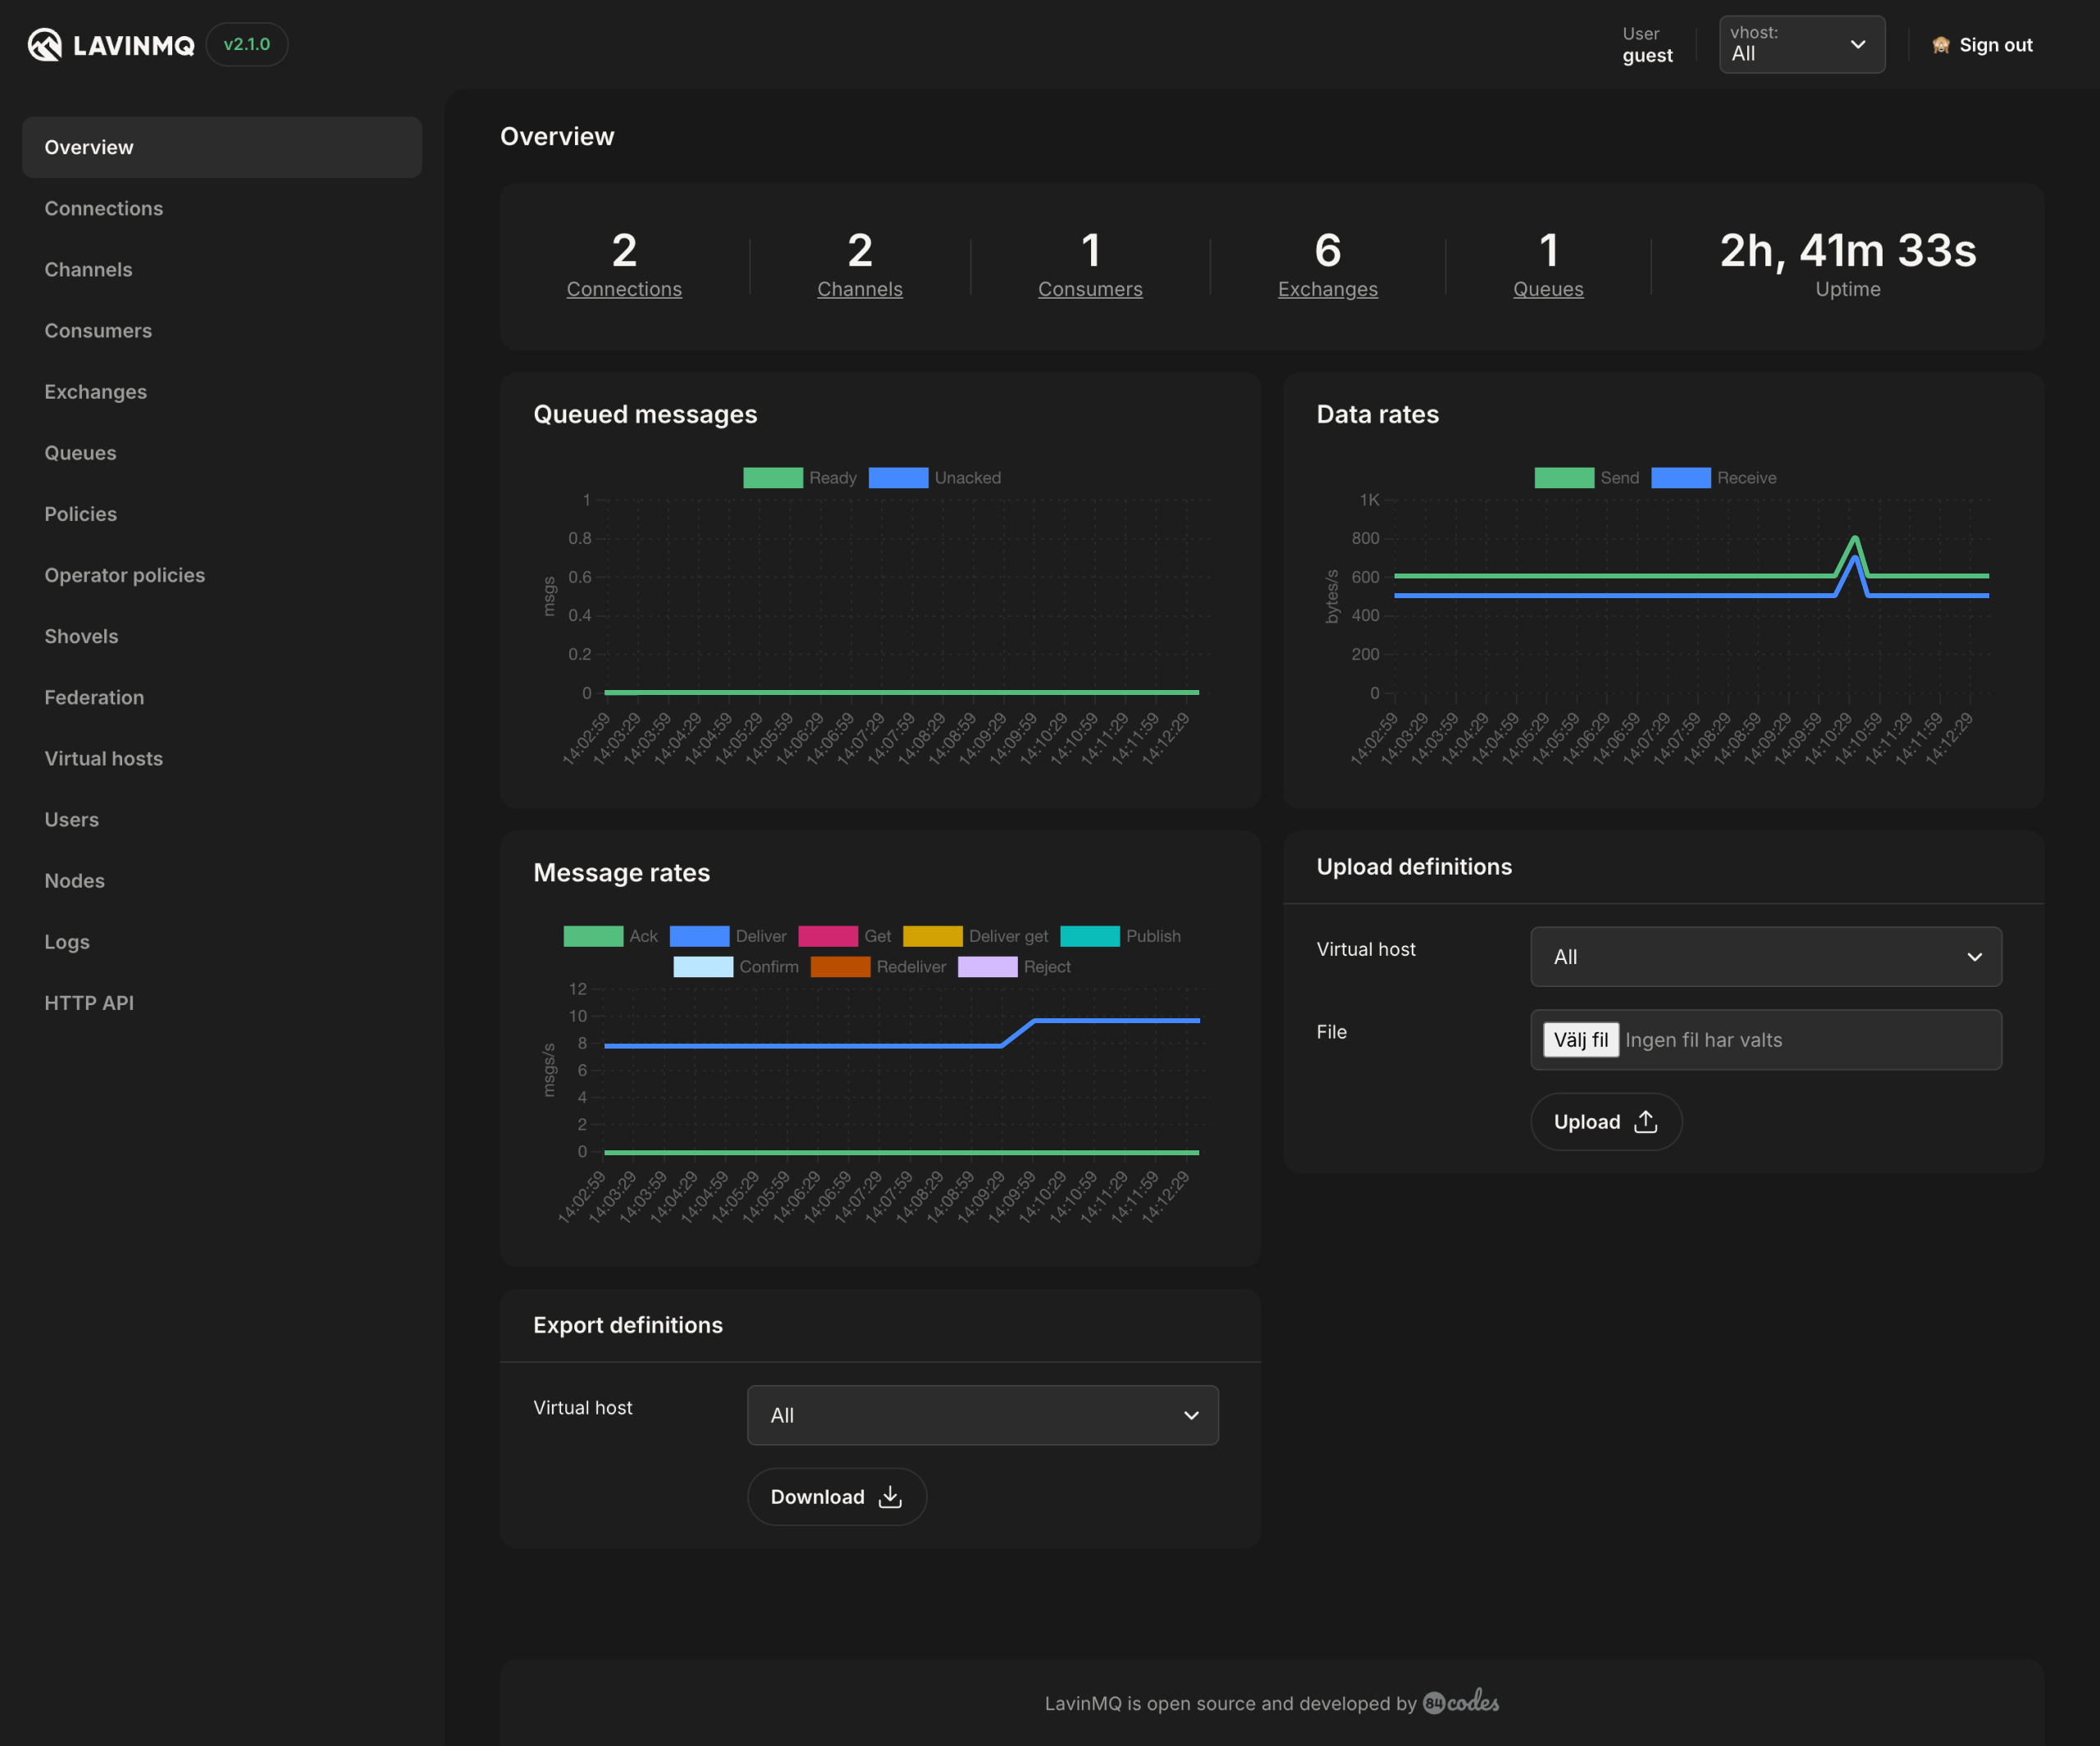
There are a couple of sections in this view:
- An overview of the number of connections, channels, consumers, exchanges, and queues as well as uptime. Click on connections, channels, exchanges, and queues to drill down to a more detailed view.
- Graphs for the number of queued messages with ready, unacked, and total, as well as Data Rates in bytes per second and Message Rates in messages per second. The graphs will show data for the last 5 minutes or hover over them to show the metric for a specific time. Hide metrics by clicking on the name on the right side of the graph. A checkmark (✓) will show if the metric is displayed in the graph.
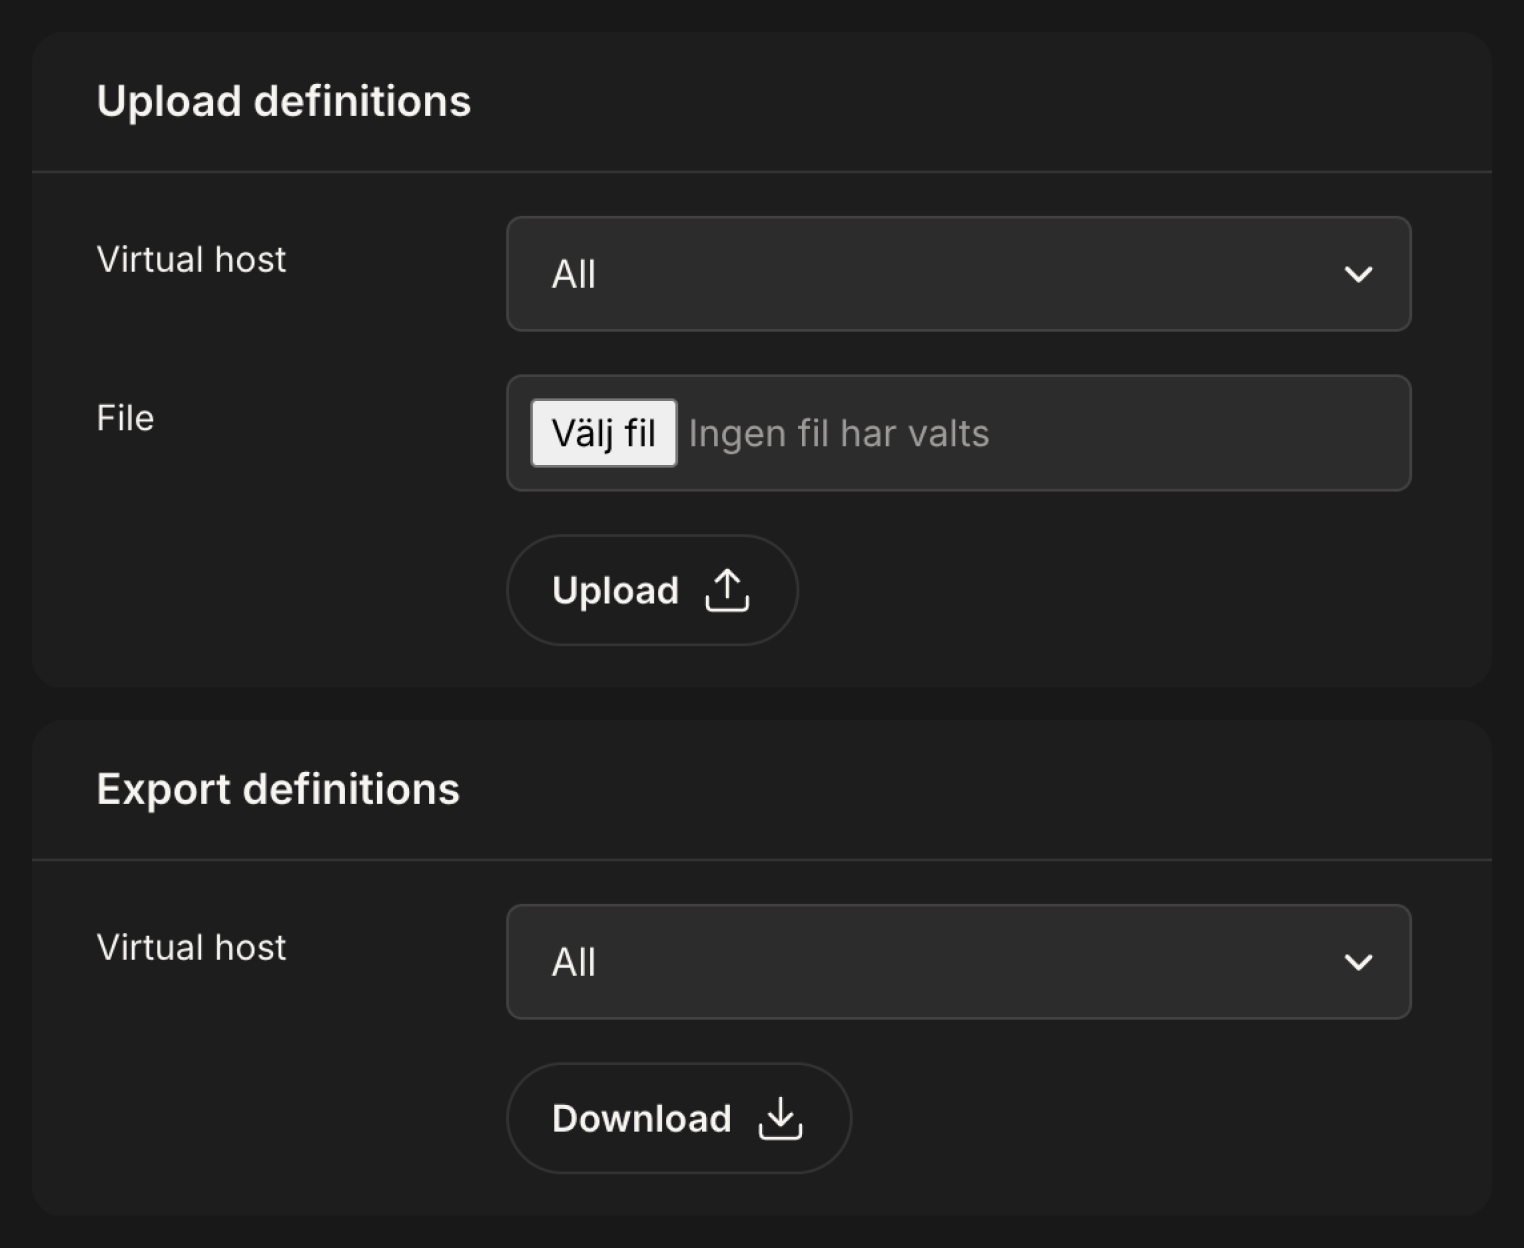
- Definitions export and upload section, used to export and upload definitions from a file.
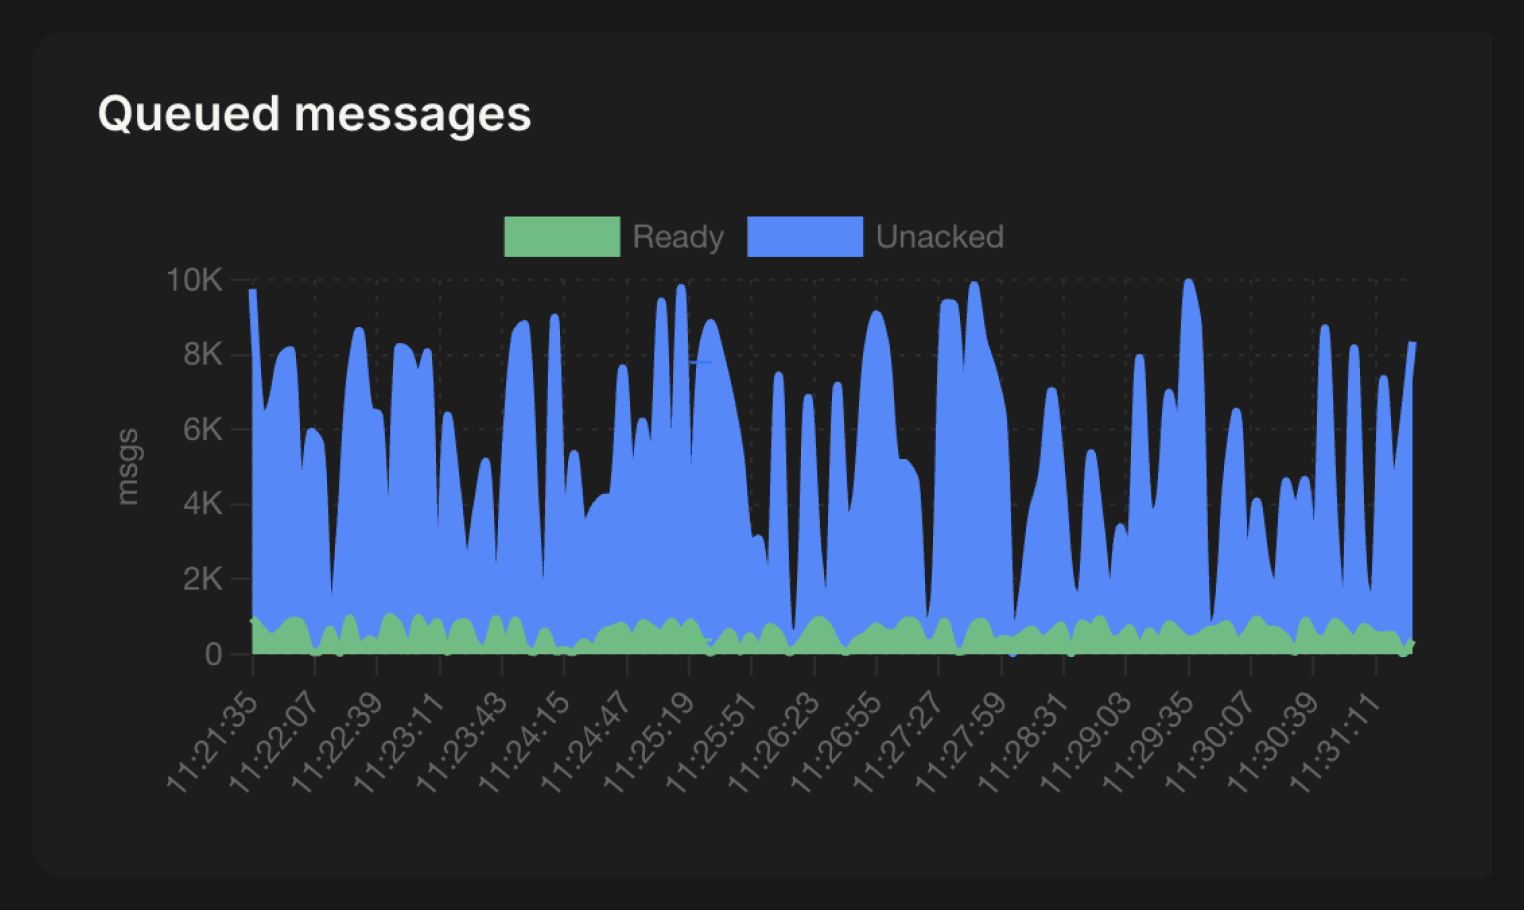
The Queued message graph will show the total number of messages in queues and messages that are being processed by consumers.
- Unacked: When a message is in the unacknowledged state, it means that a consumer is processing it but has not sent an acknowledgement to the broker yet.
- Ready: When a message is in the ready state, it means that the message is still in a queue, waiting to be processed by a consumer.
- Total: Shows the total amount of messages in the queue, unacknowledged and ready messages.
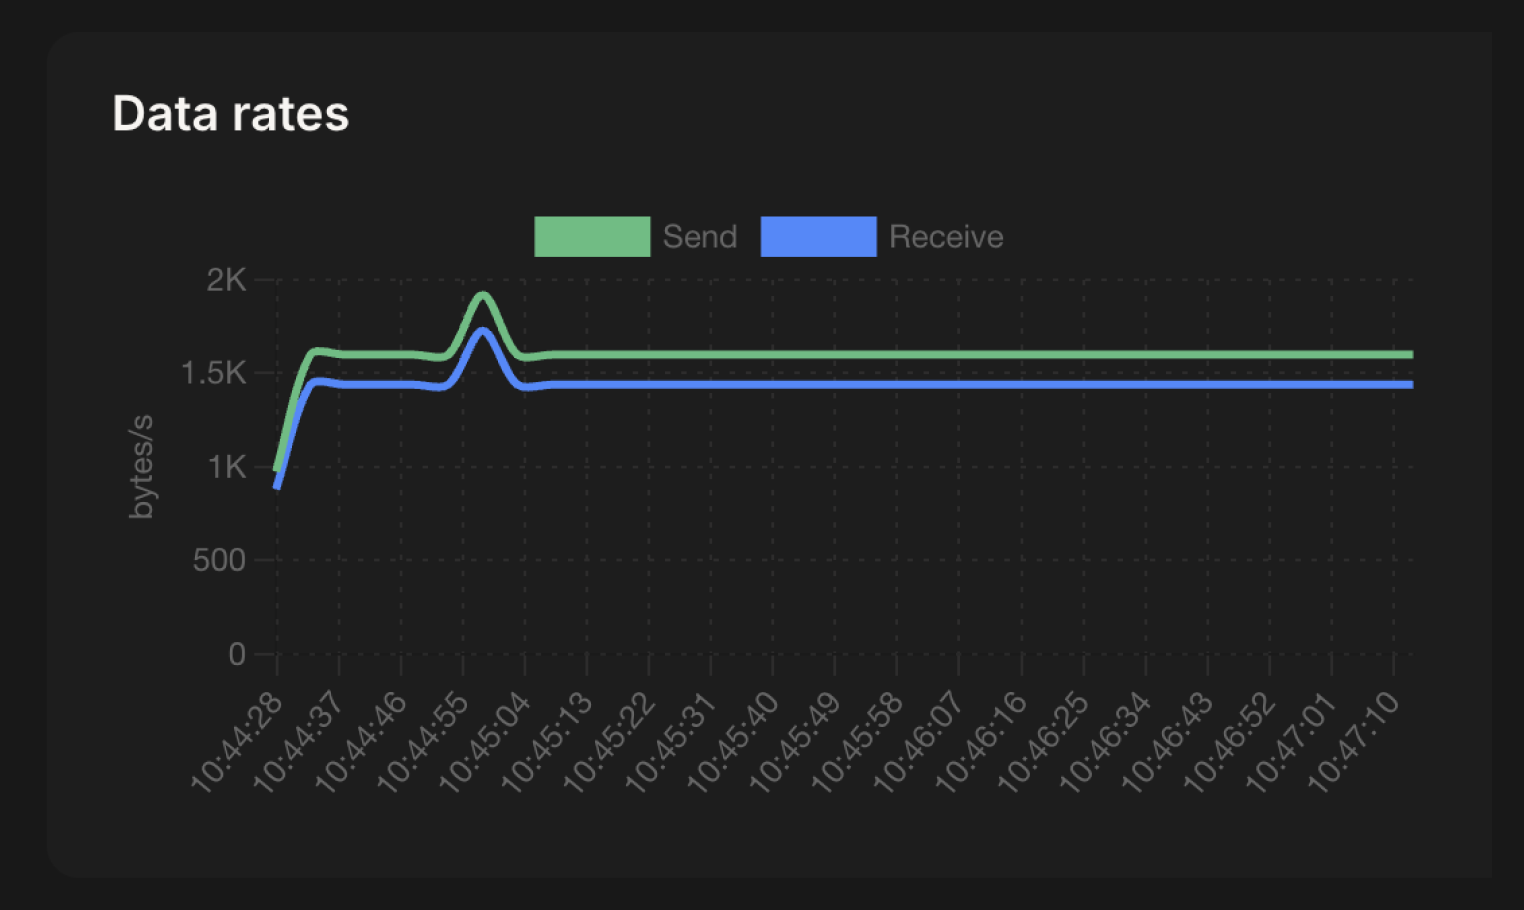
The data rates graph shows how many bytes of data are being sent and received by the broker per second.
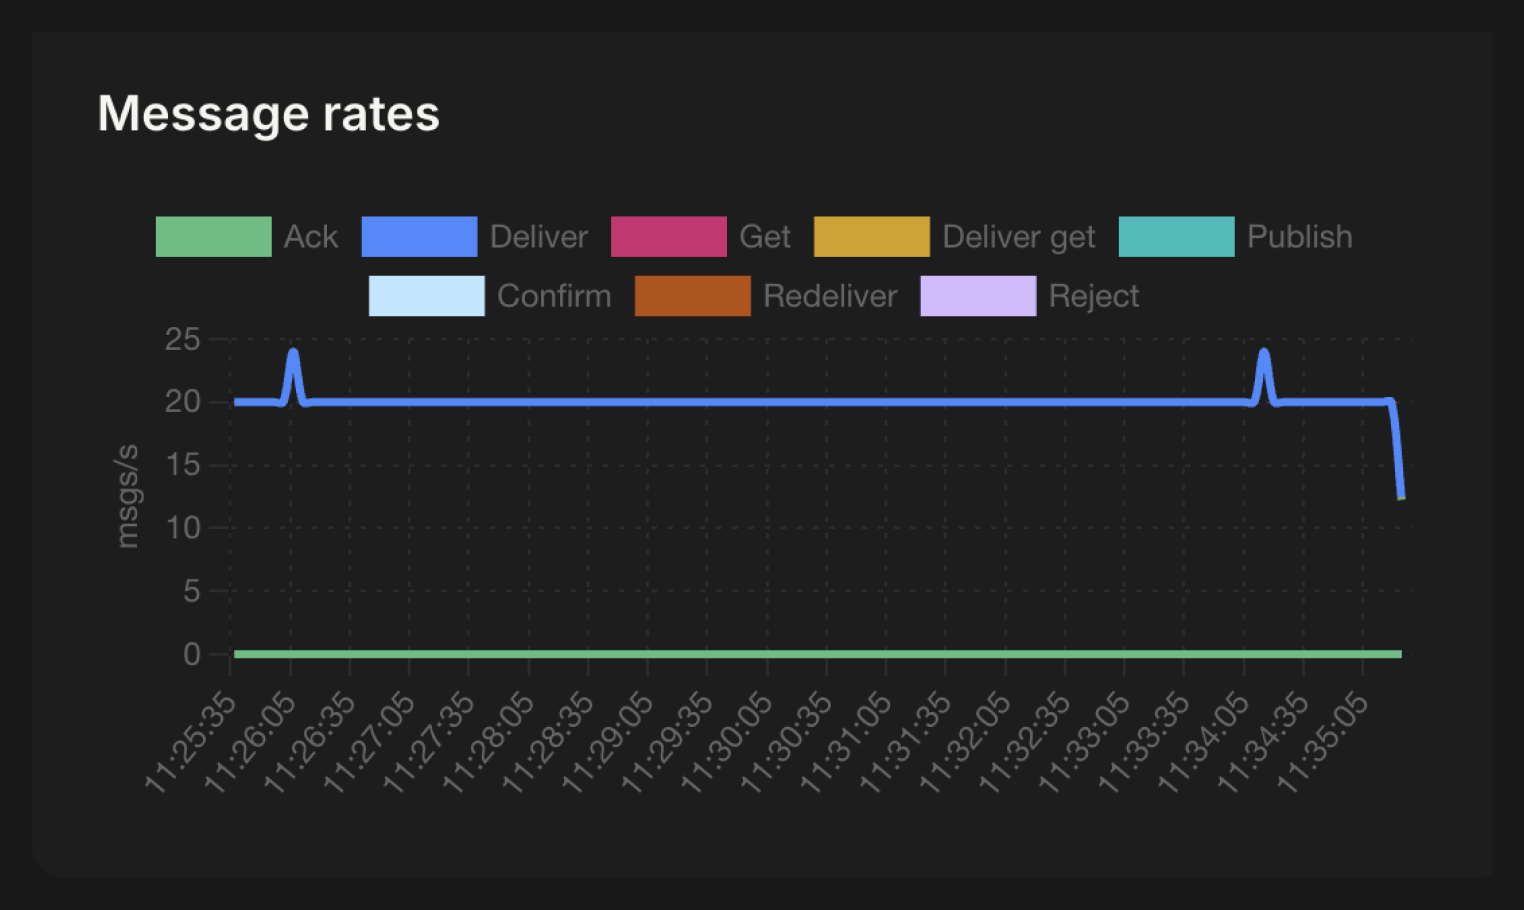
The message rates graph shows how many messages are being published, delivered, get, acknowledged, redelivered and rejected each second.
Definitions include node and cluster objects such as vhosts, queues, users, permissions, policies, exchanges, bindings, and parameters. It is possible to upload and export definitions per vhost or for all vhosts. When the definitions are downloaded, a json file will be created. When a file is selected to be uploaded, it needs to be in json format. Definitions can be used to restore the objects listed above and be used as a backup.
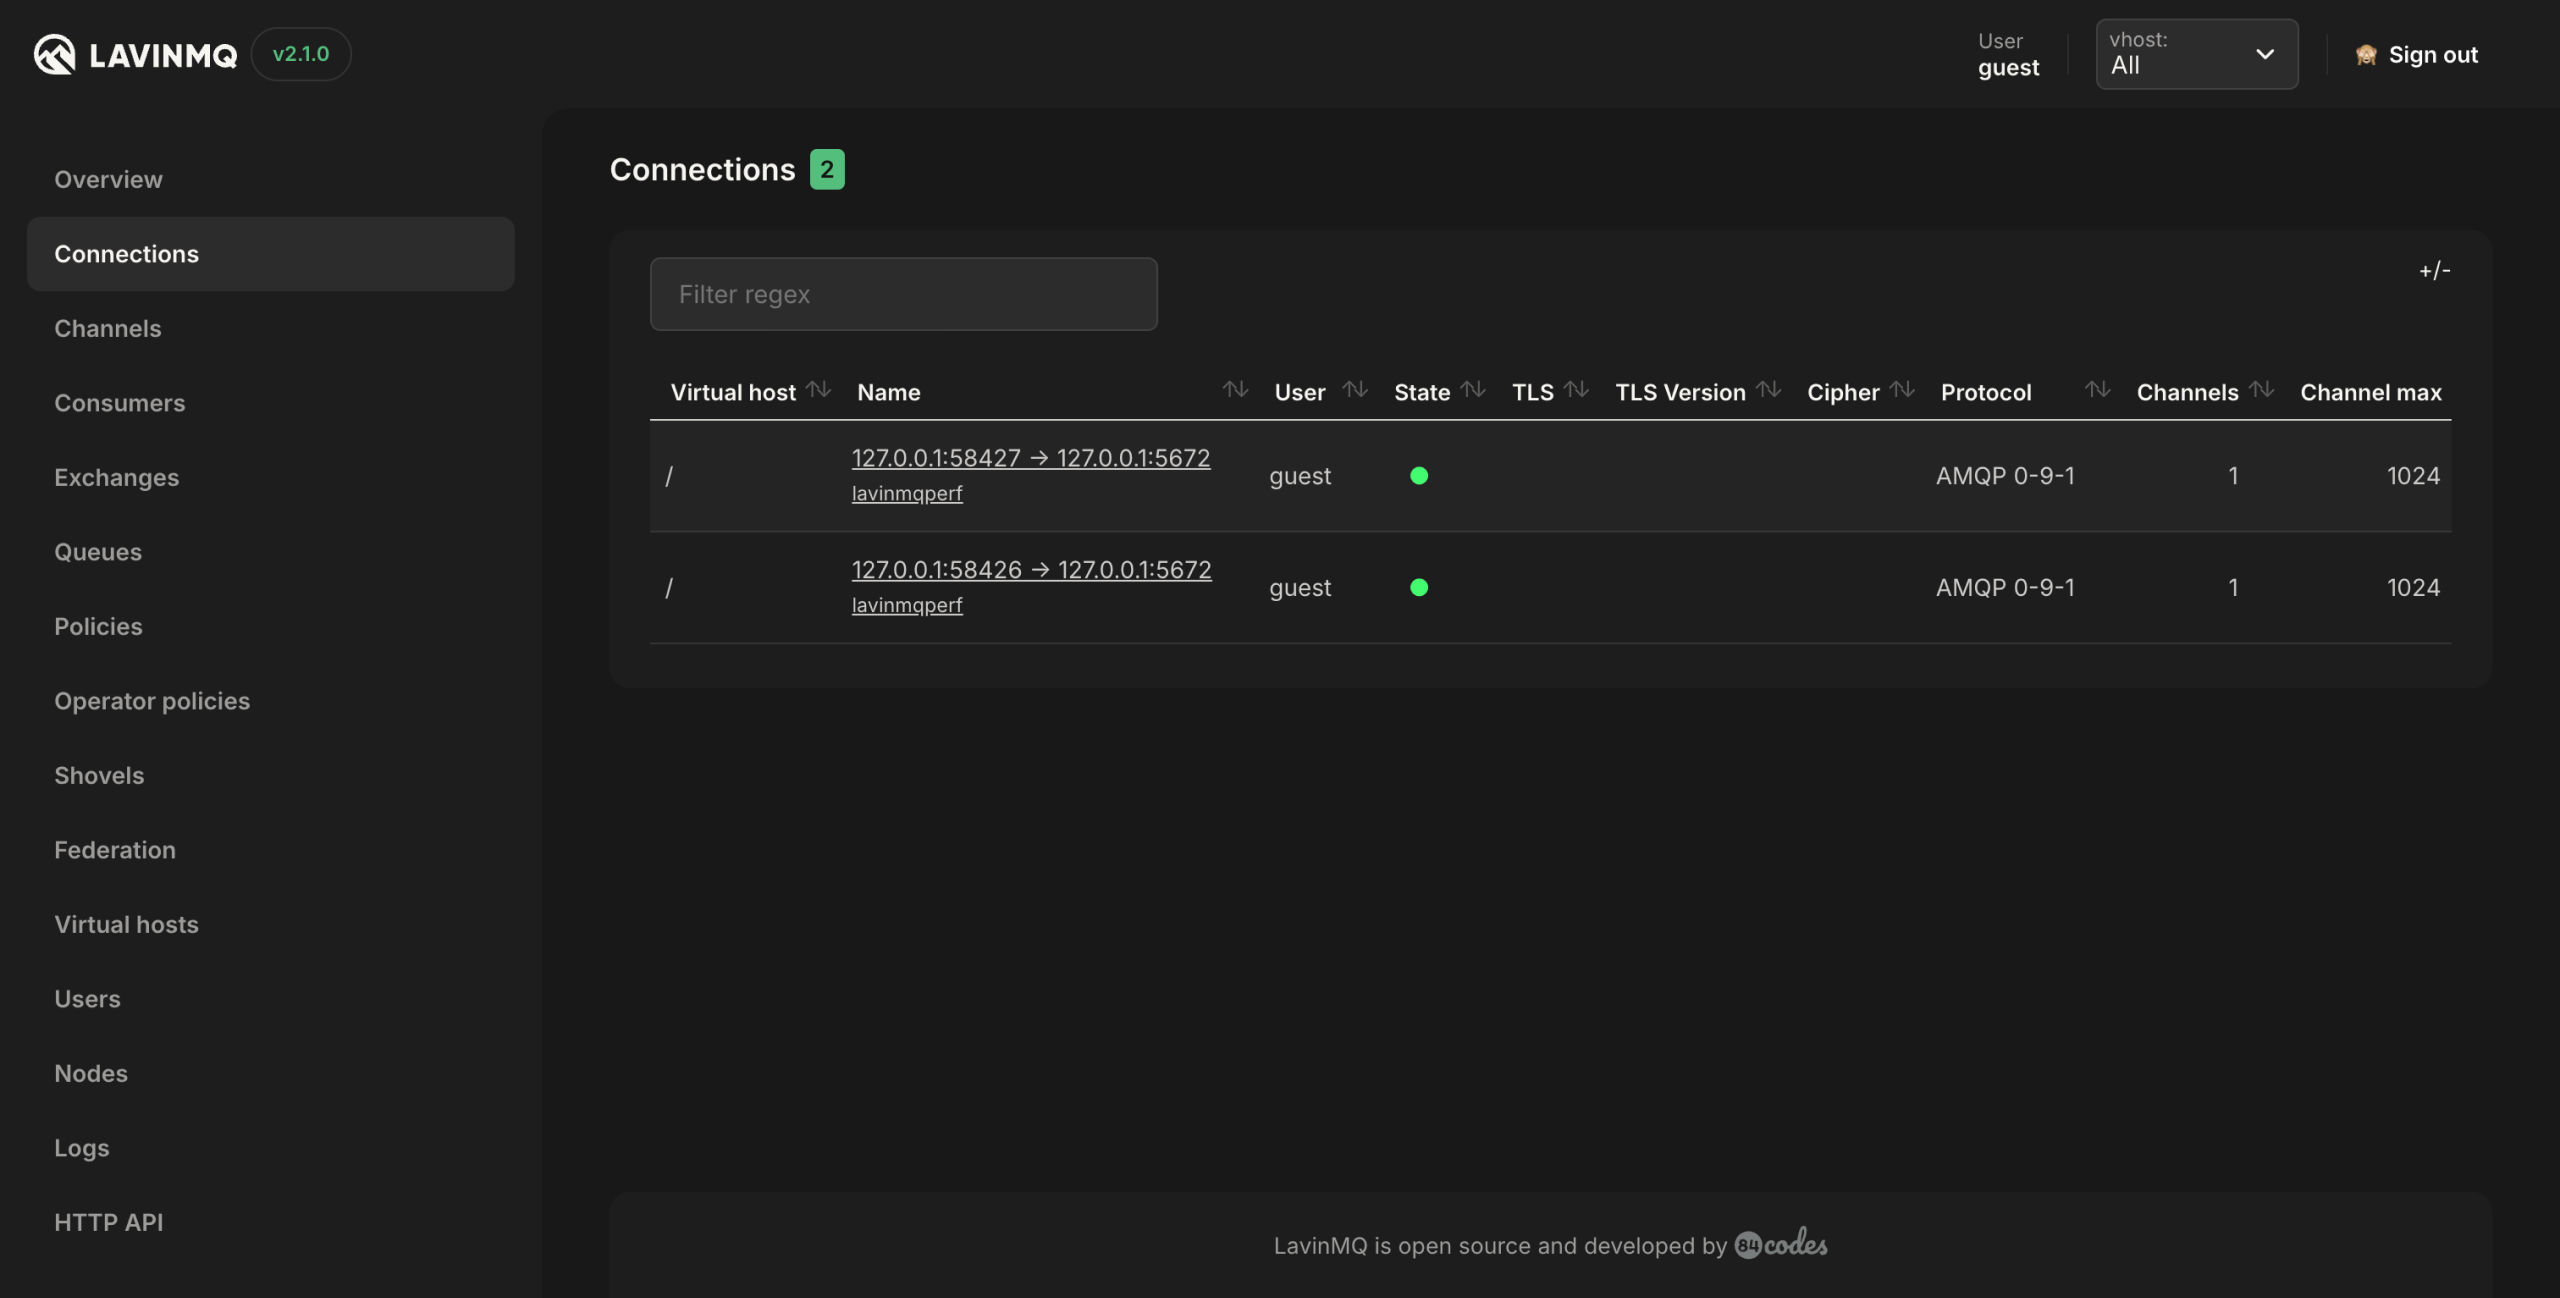
LavinMQ Management Interface Connections
This tab shows a detailed view of all connections connected to the broker. The table includes the columns:
- Virtual host: the vhost where a connection operates.
- Name the name of a connection.
- User: Associated user.
- State: Connection state; one of:
- Starting
- Tuning
- Opening
- running
- flow
- blocking
- blocked
- closing
- closed
- TLS: boolean indicating whether the connection is secured with TLS/SSL.
- TLS Version: SSL protocol, for example tlsv1.2.
- Cipher: SSL cipher algorithm, for example aes_256_cbc
- Protocol: Version of the AMQP protocol, for example 0-9-1.
- Channels: Number of channels using a connection.
- Channel max: Maximum number of channels allowed.
- Heartbeat: Negotiated heartbeat value in seconds.
- Client: Client library used.
- Connected at: Date and time when a connection was established.
- Sent bytes
- Delivered bytes
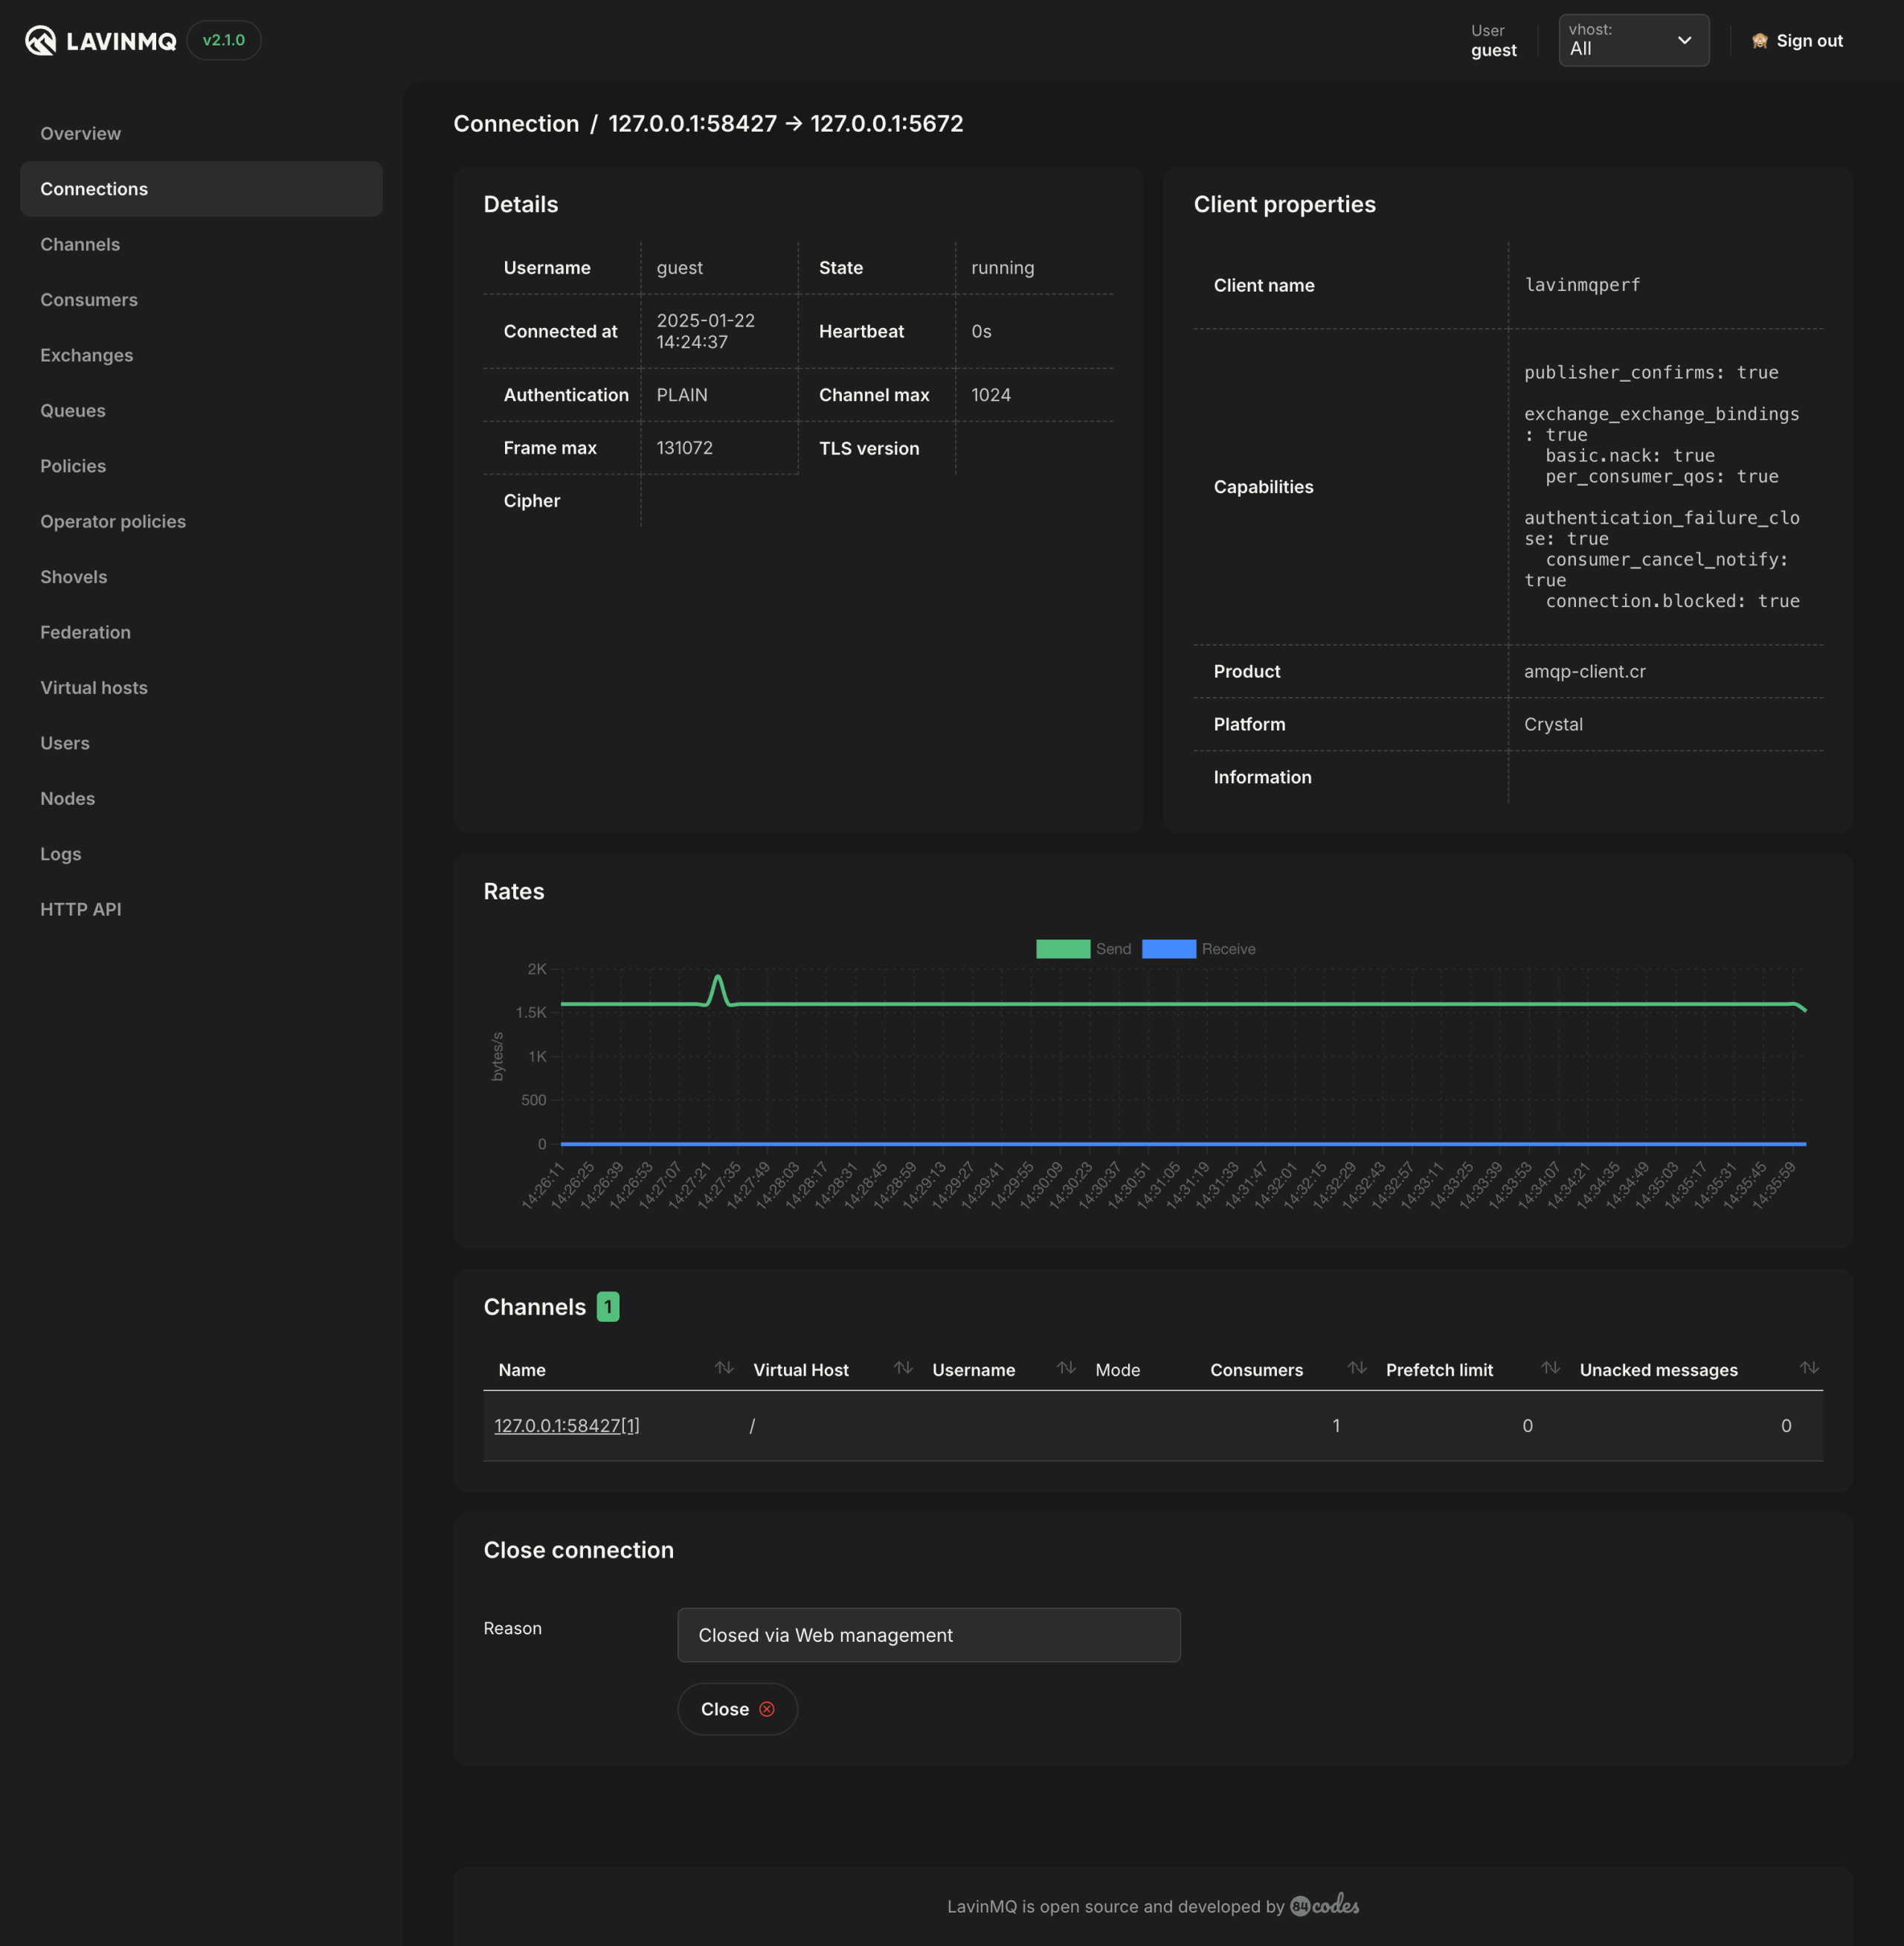
Clicking on the name of the connection gives an even more detailed view. This view shows details for a specific connection, its client properties, data rates, channels, and a way to close the connection. From here you can also drill down further to channels
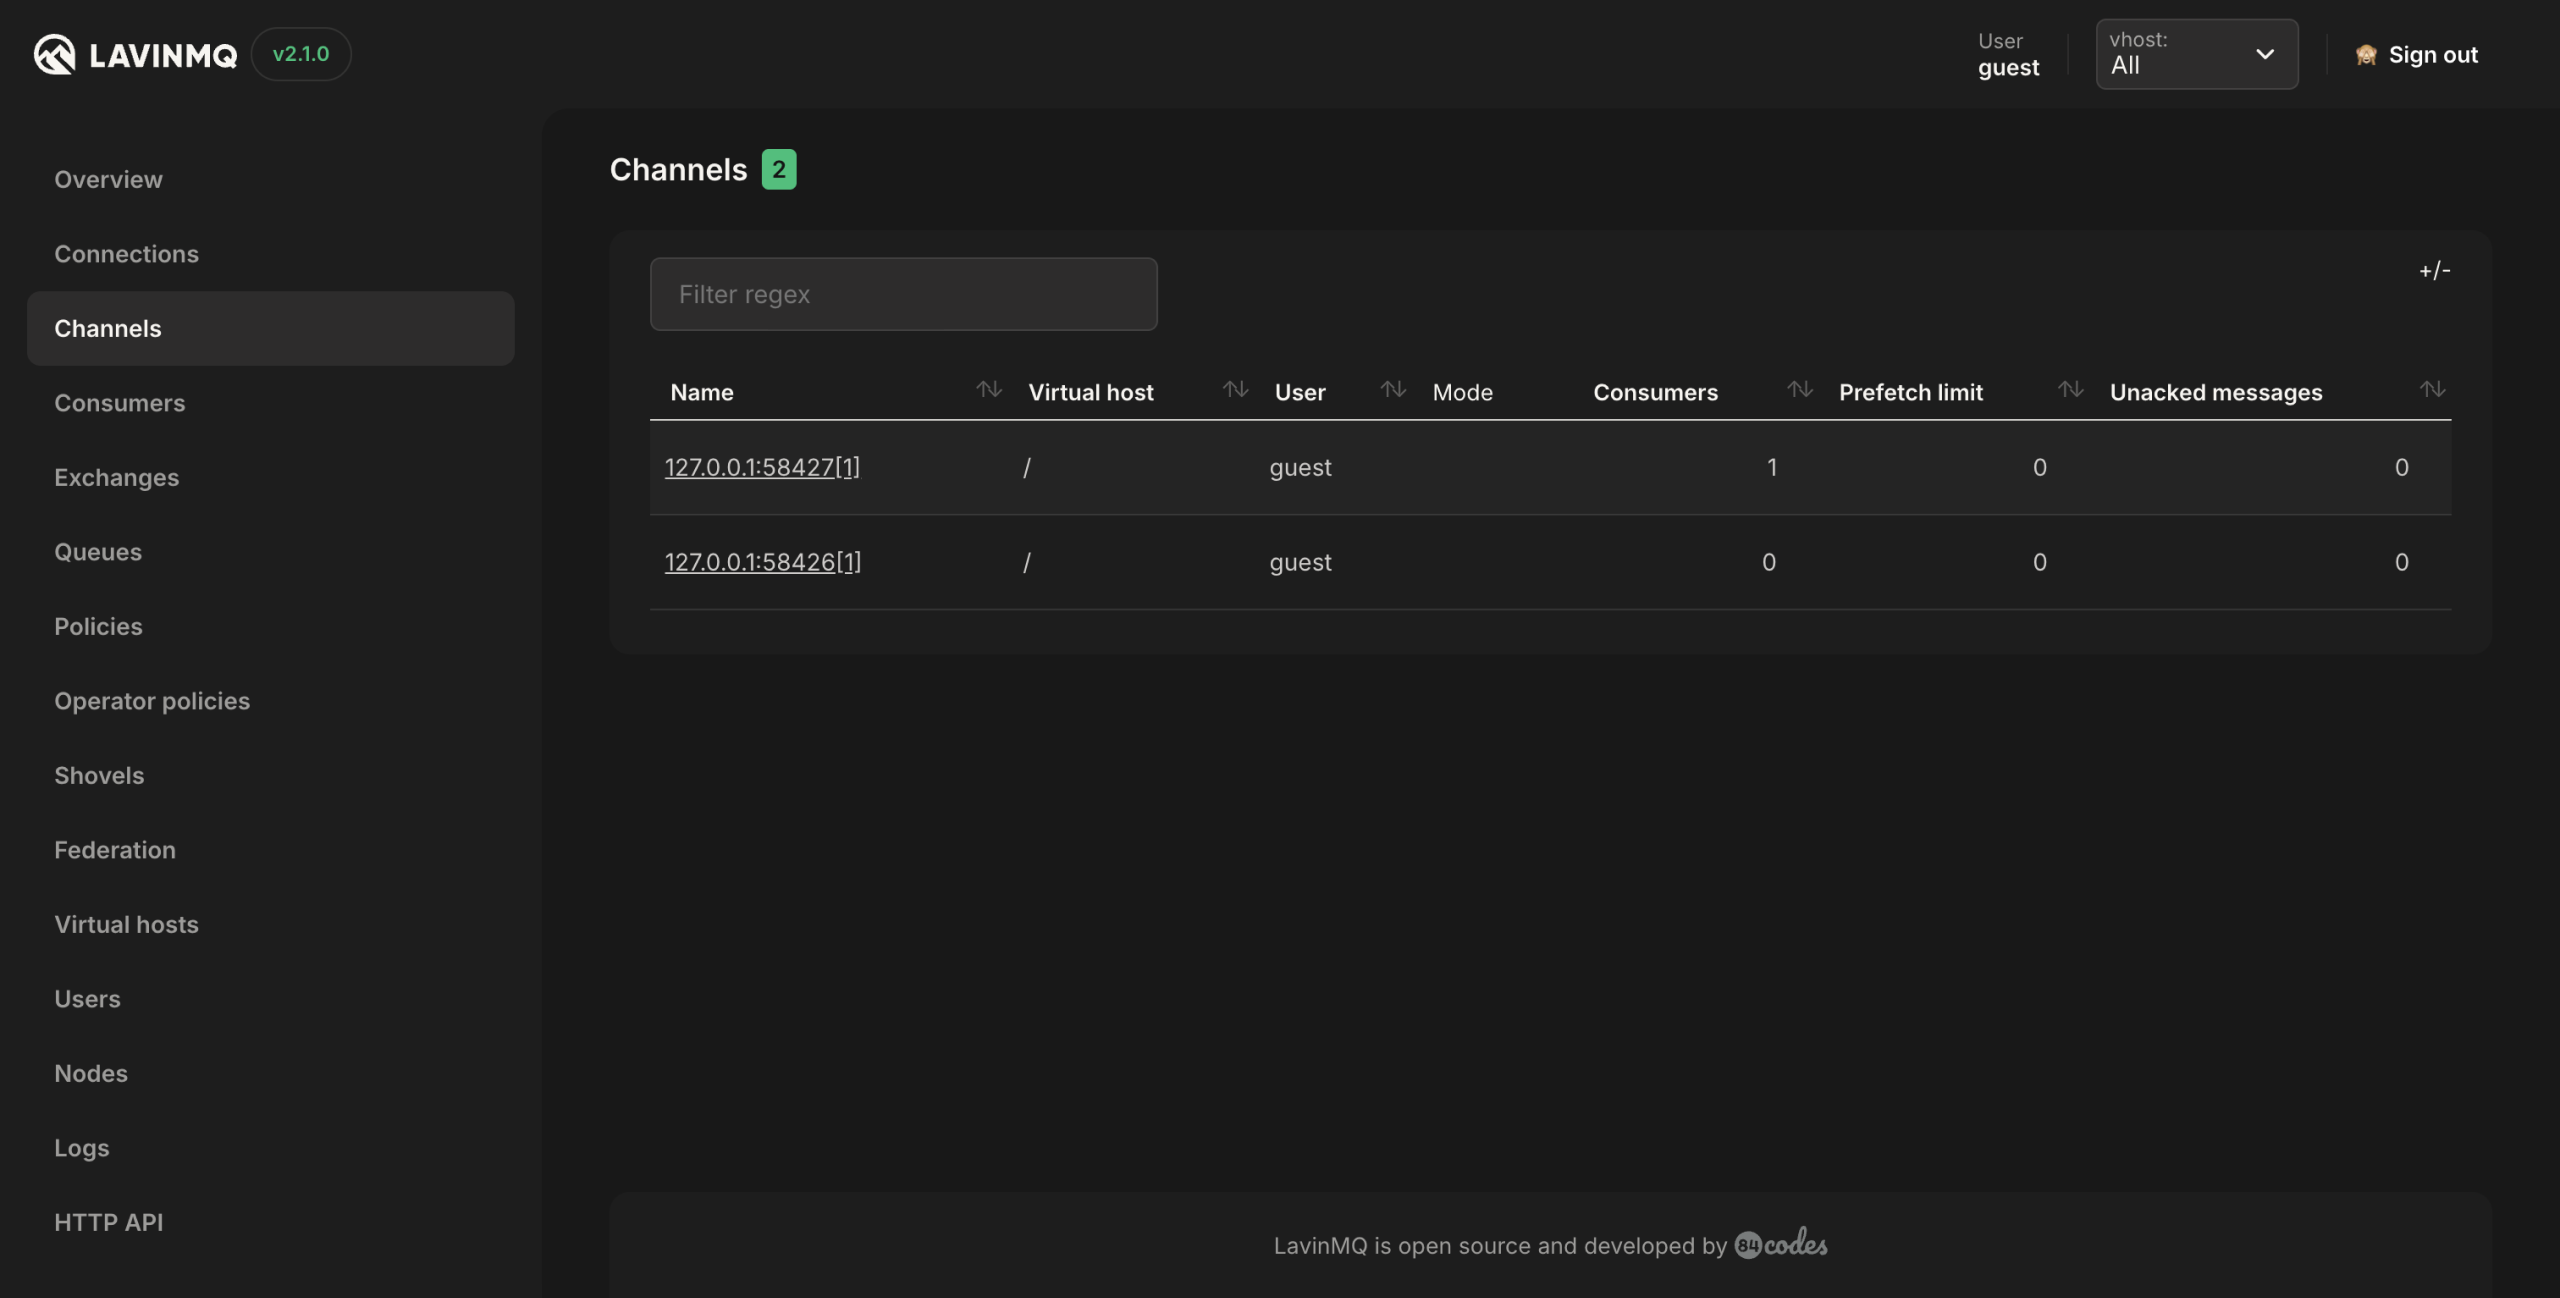
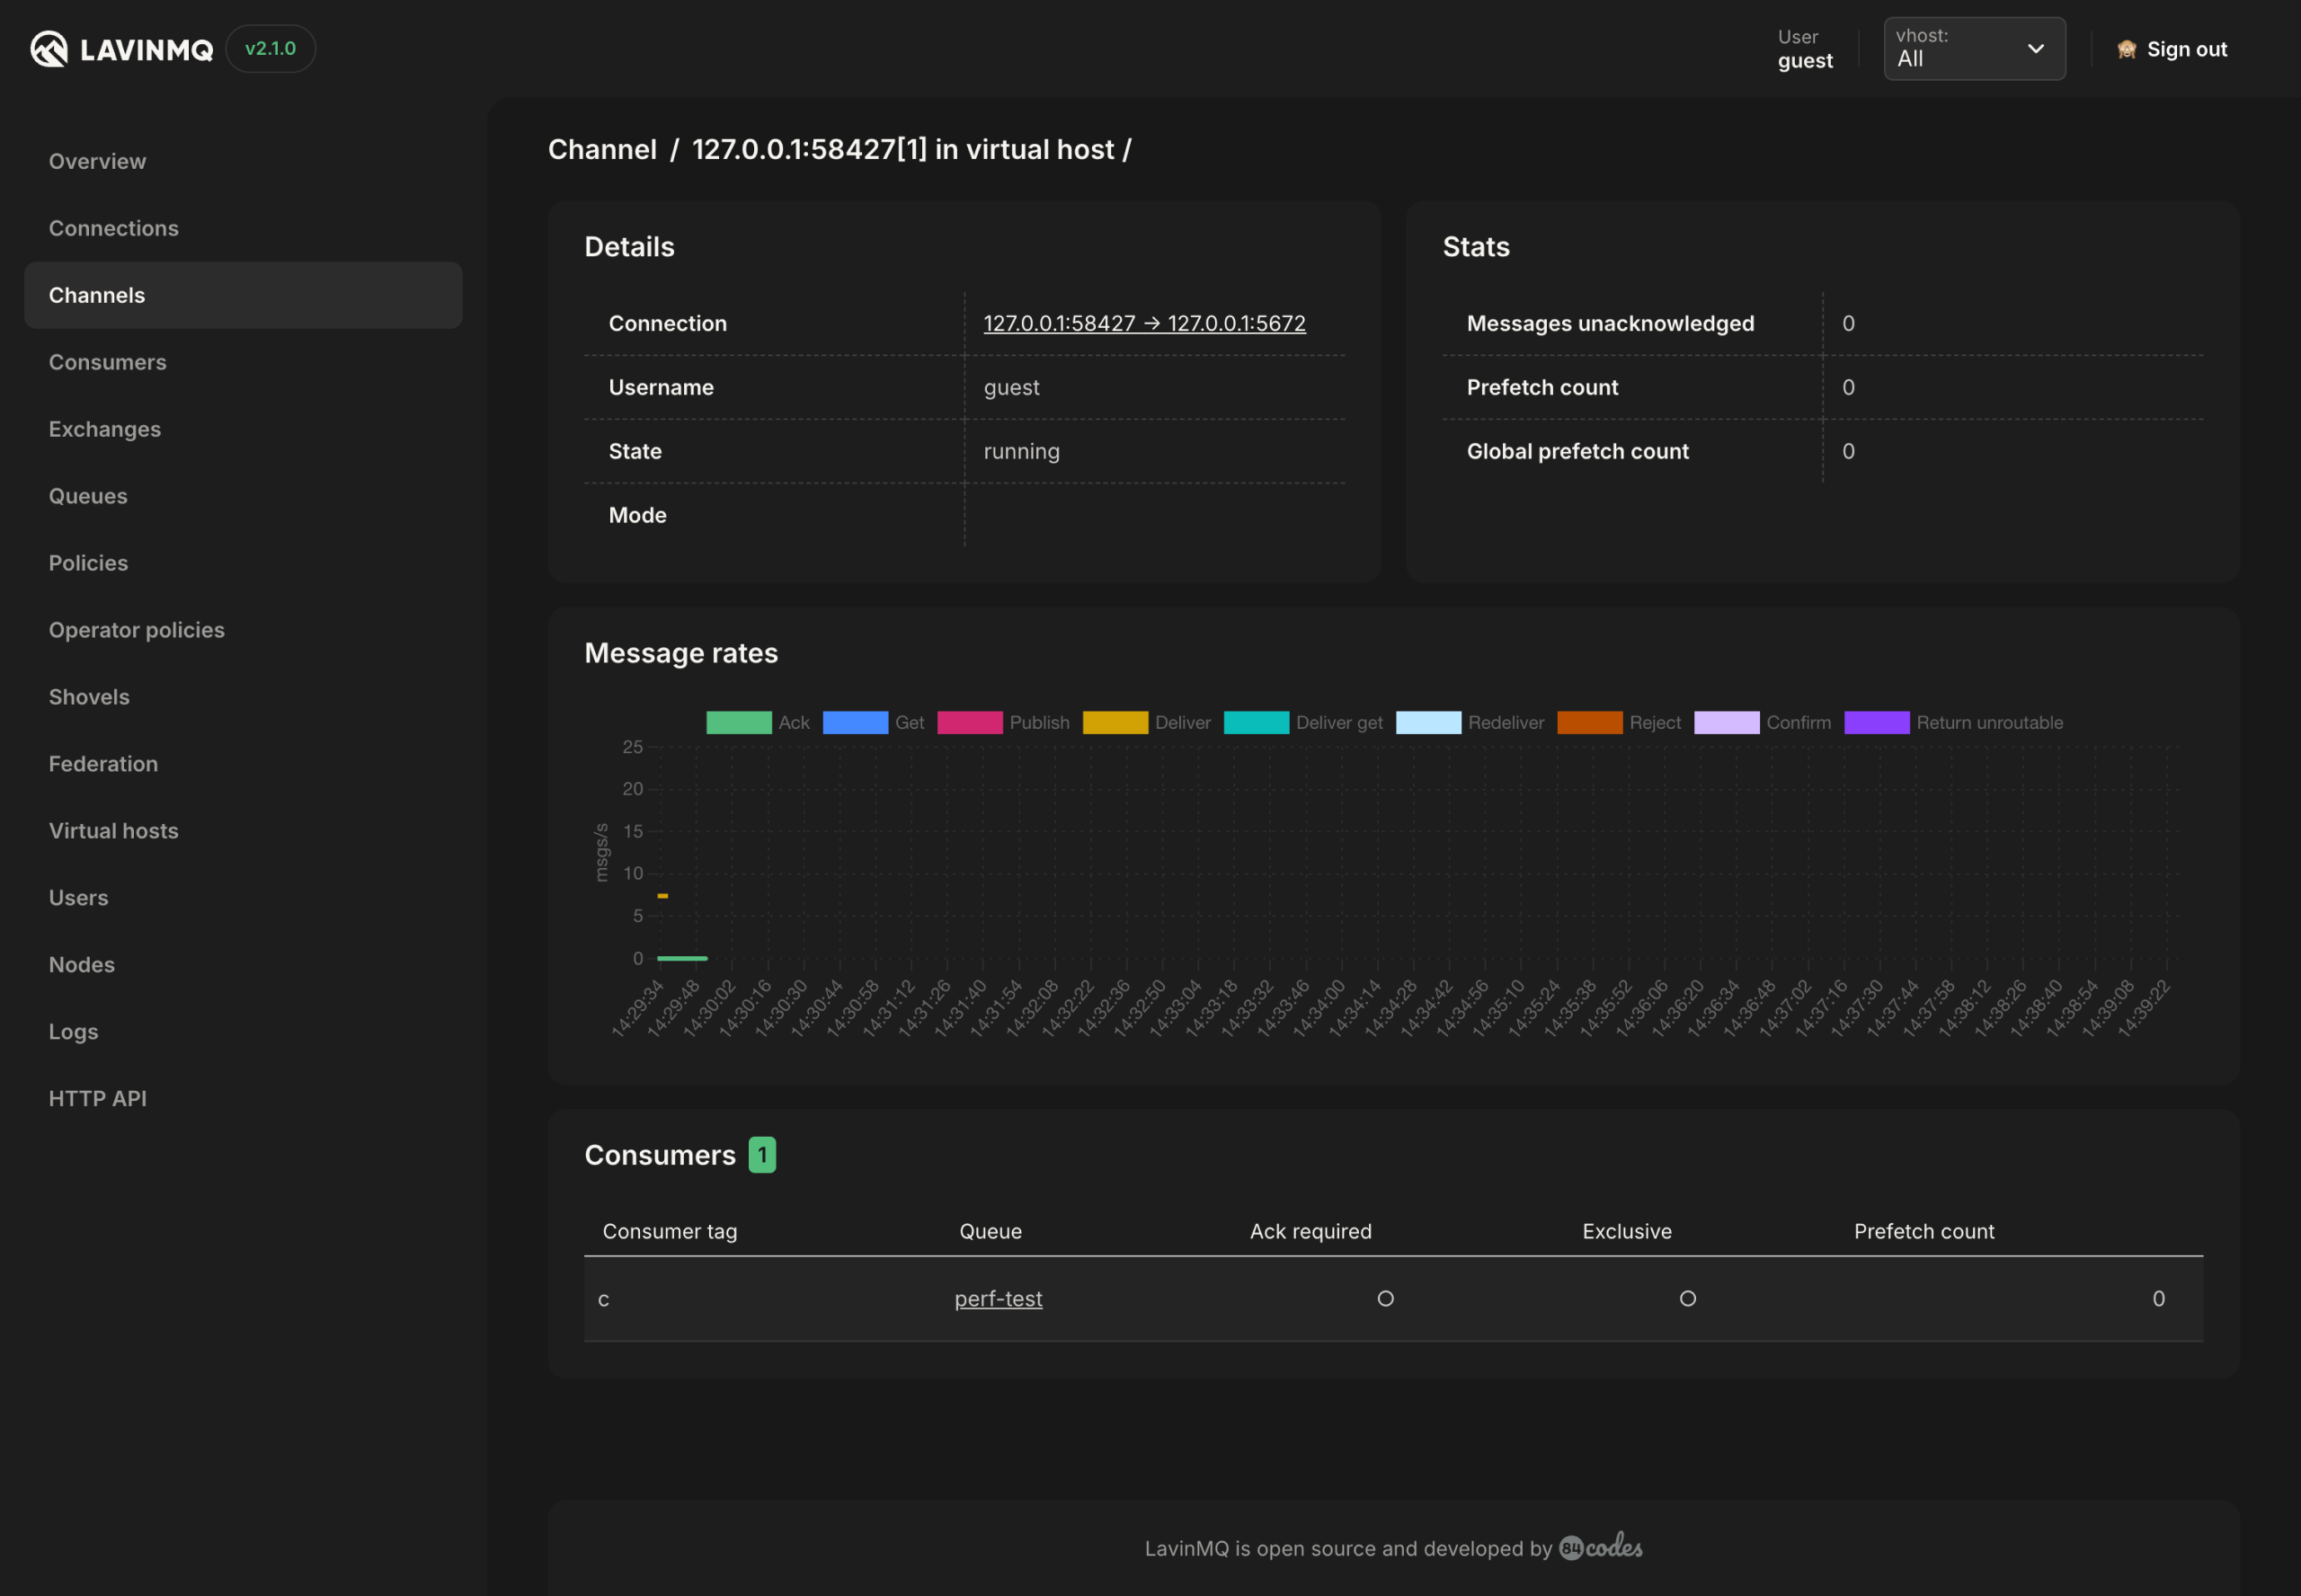
Channels
The Channels tab shows a detailed view of all channels open. The table includes the columns:
- Name the name of a channel.
- Virtual host: the vhost where a channel operates.
- User: Associated user.
- Mode: the channel guarantee mode, in either confirm or transactional mode.
- Consumers: Number of consumers retrieving messages via the channel.
- Prefetch limit: prefetch limit for consumers, 0 if unlimited.
- Unacked messages: number of messages that are unacked by consumers via the channel.
Clicking on the name of the channel gives an even more detailed view. This view will show details for a specific channel, it’s stats, message rates, and consumers. From here you can also drill down further to the consumer linked queue.
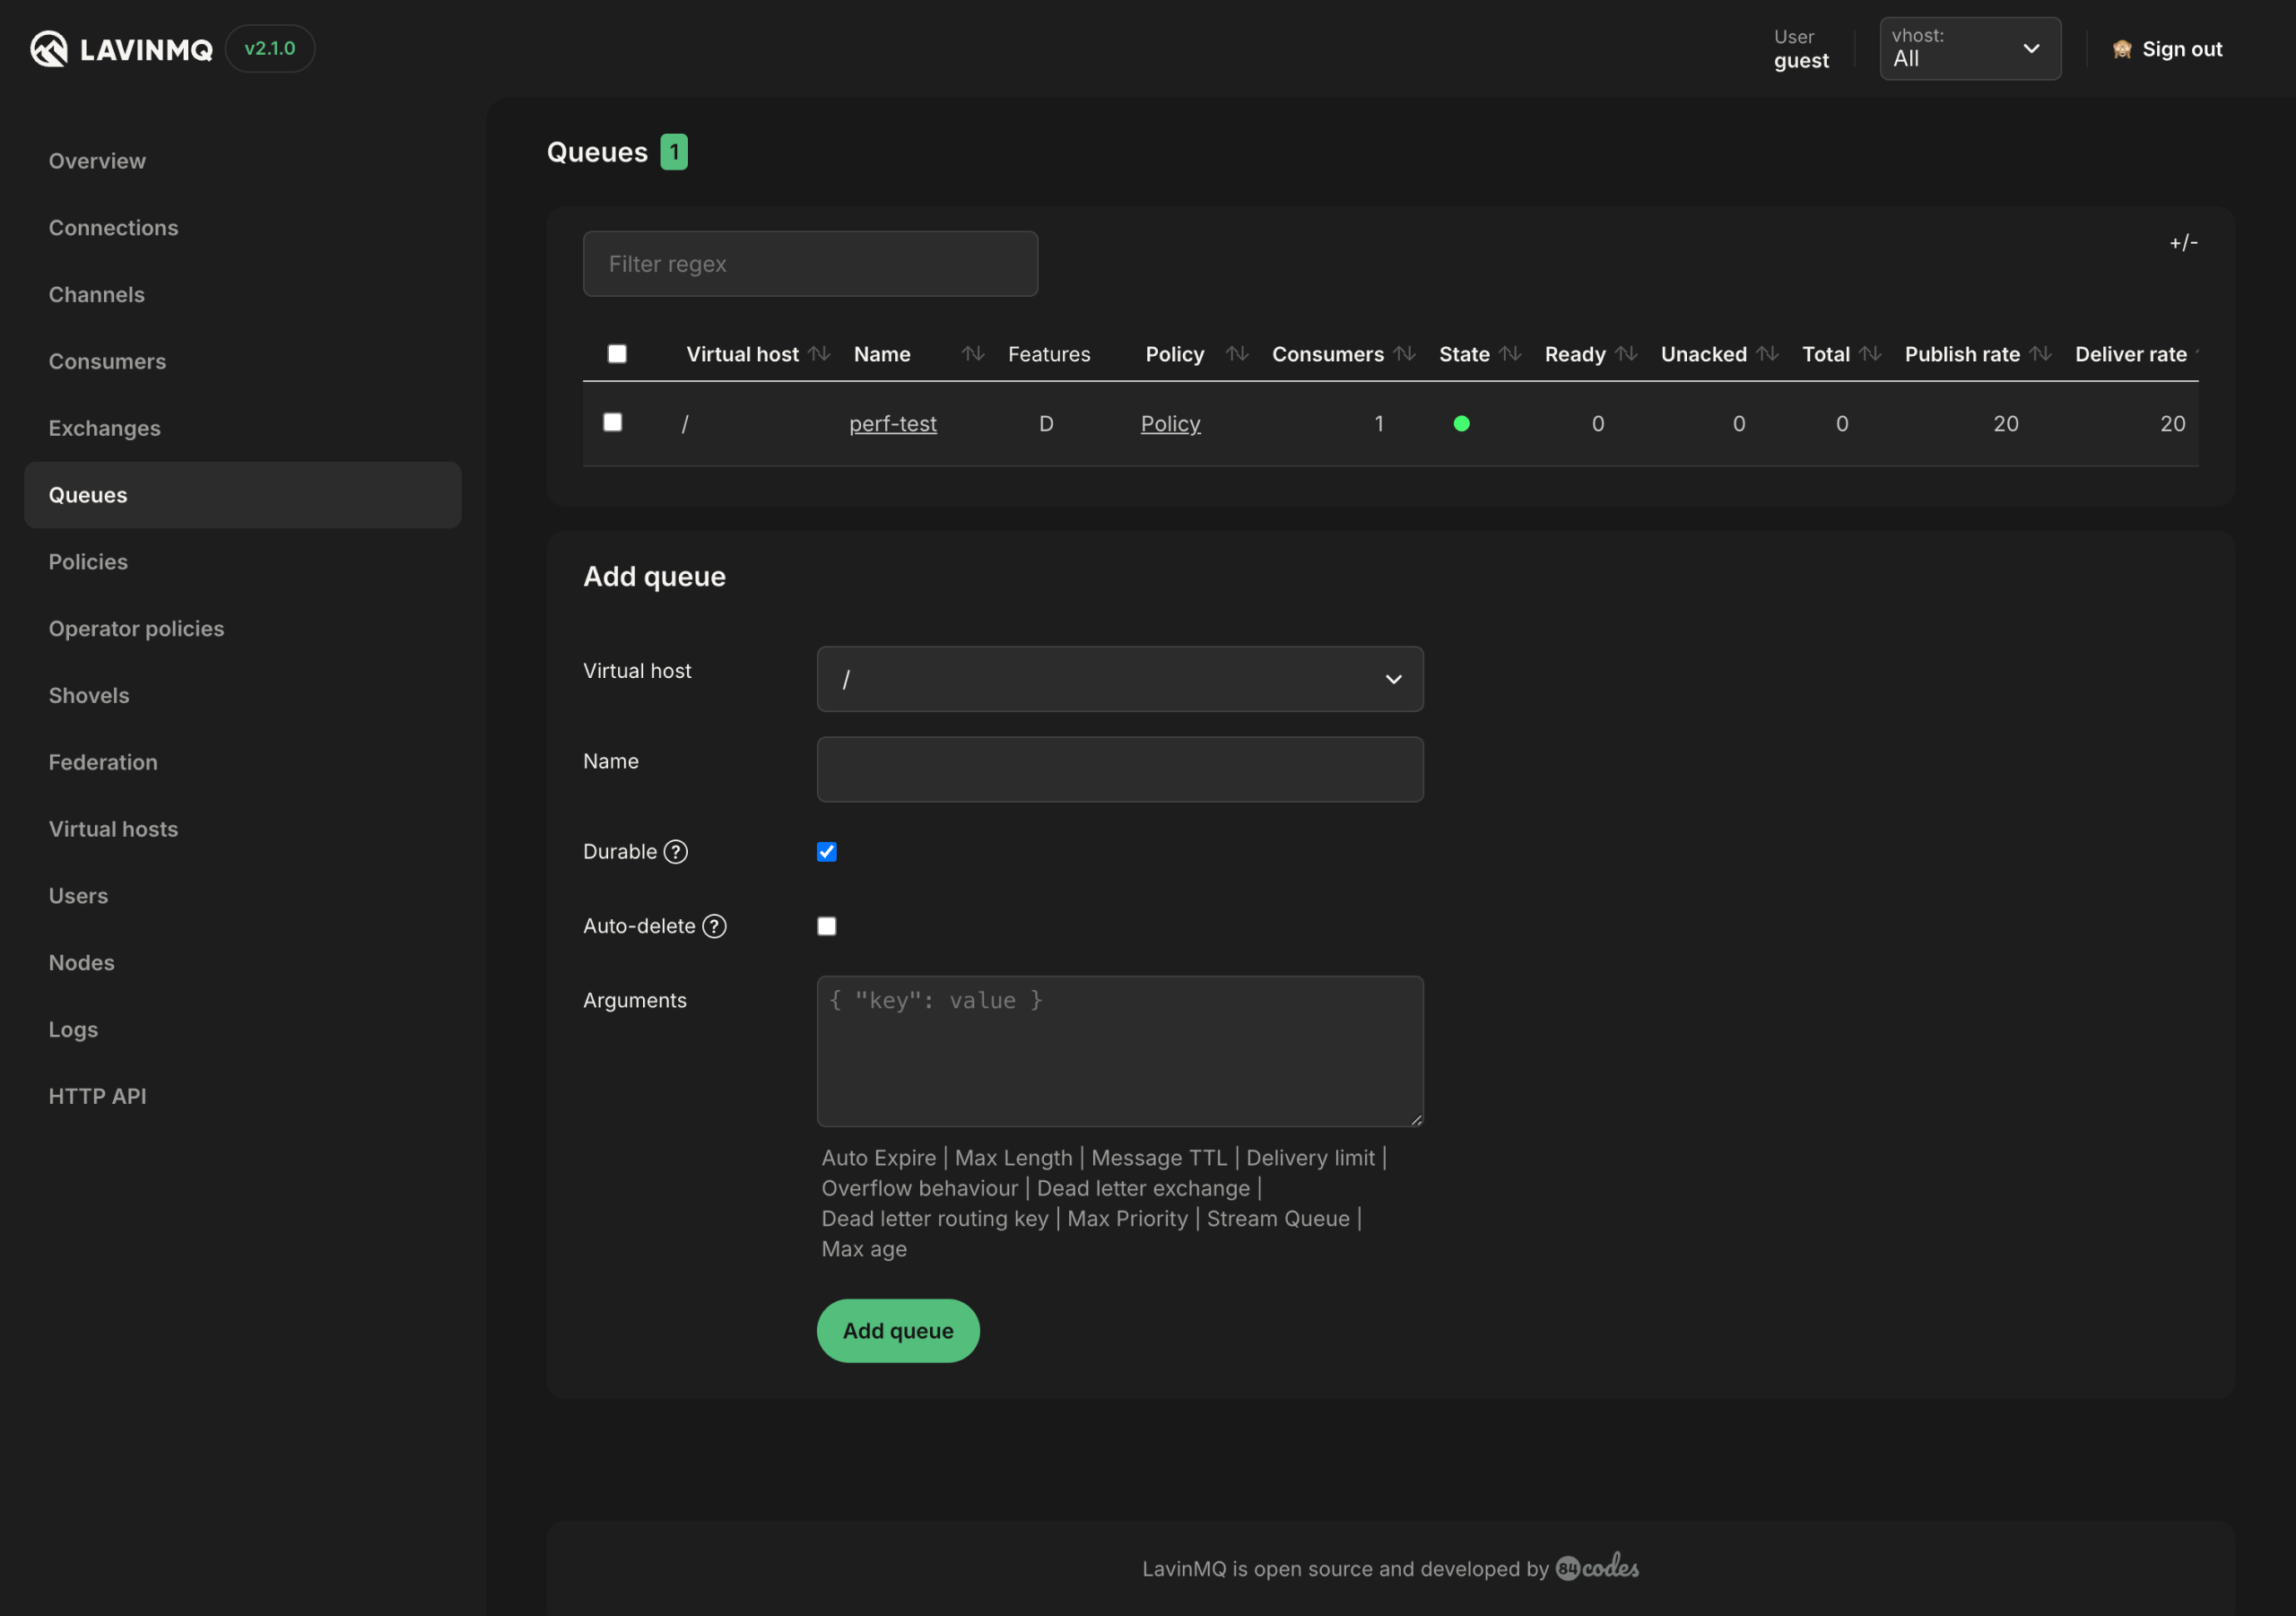
Queues
The queues tab shows a detailed view of all queues. The table includes the columns:
- Virtual host: the vhost where a queue operates.
- Name the name of a queue.
- Features: the parameters that belong to the queue, for example durable, auto-expire, etc.
- Policy: effective policy applied to the queue.
- Consumers: number of consumers connected to the queue.
- State: The state of the queue, normally “running”.
- Ready: Number of messages ready to be delivered to clients.
- Unacked: Number of messages delivered to clients but not yet acknowledged.
- Total: Sum of ready and unacknowledged messages.
- Publish rate: Message rate for publishing to the queue.
- Delivery rate: Message rate for delivering from the queue.
- Ack rate: Message rate for consumers acknowledging messages.
Queues have different parameters and arguments depending on how they were created. The features column shows the parameters that belong to the queue. It could be features like:
- Durable (ensures that LavinMQ will never lose the queue),
- Message TTL (how long a message published to a queue can live before it is discarded),
- Auto Expire (how long a queue can be unused before it is automatically deleted),
- Max Length (how many (ready) messages a queue can contain before it starts to drop them) and
- Max Length Bytes (the total body size for ready messages a queue can contain before it starts to drop them).
You can also create a queue from this view.
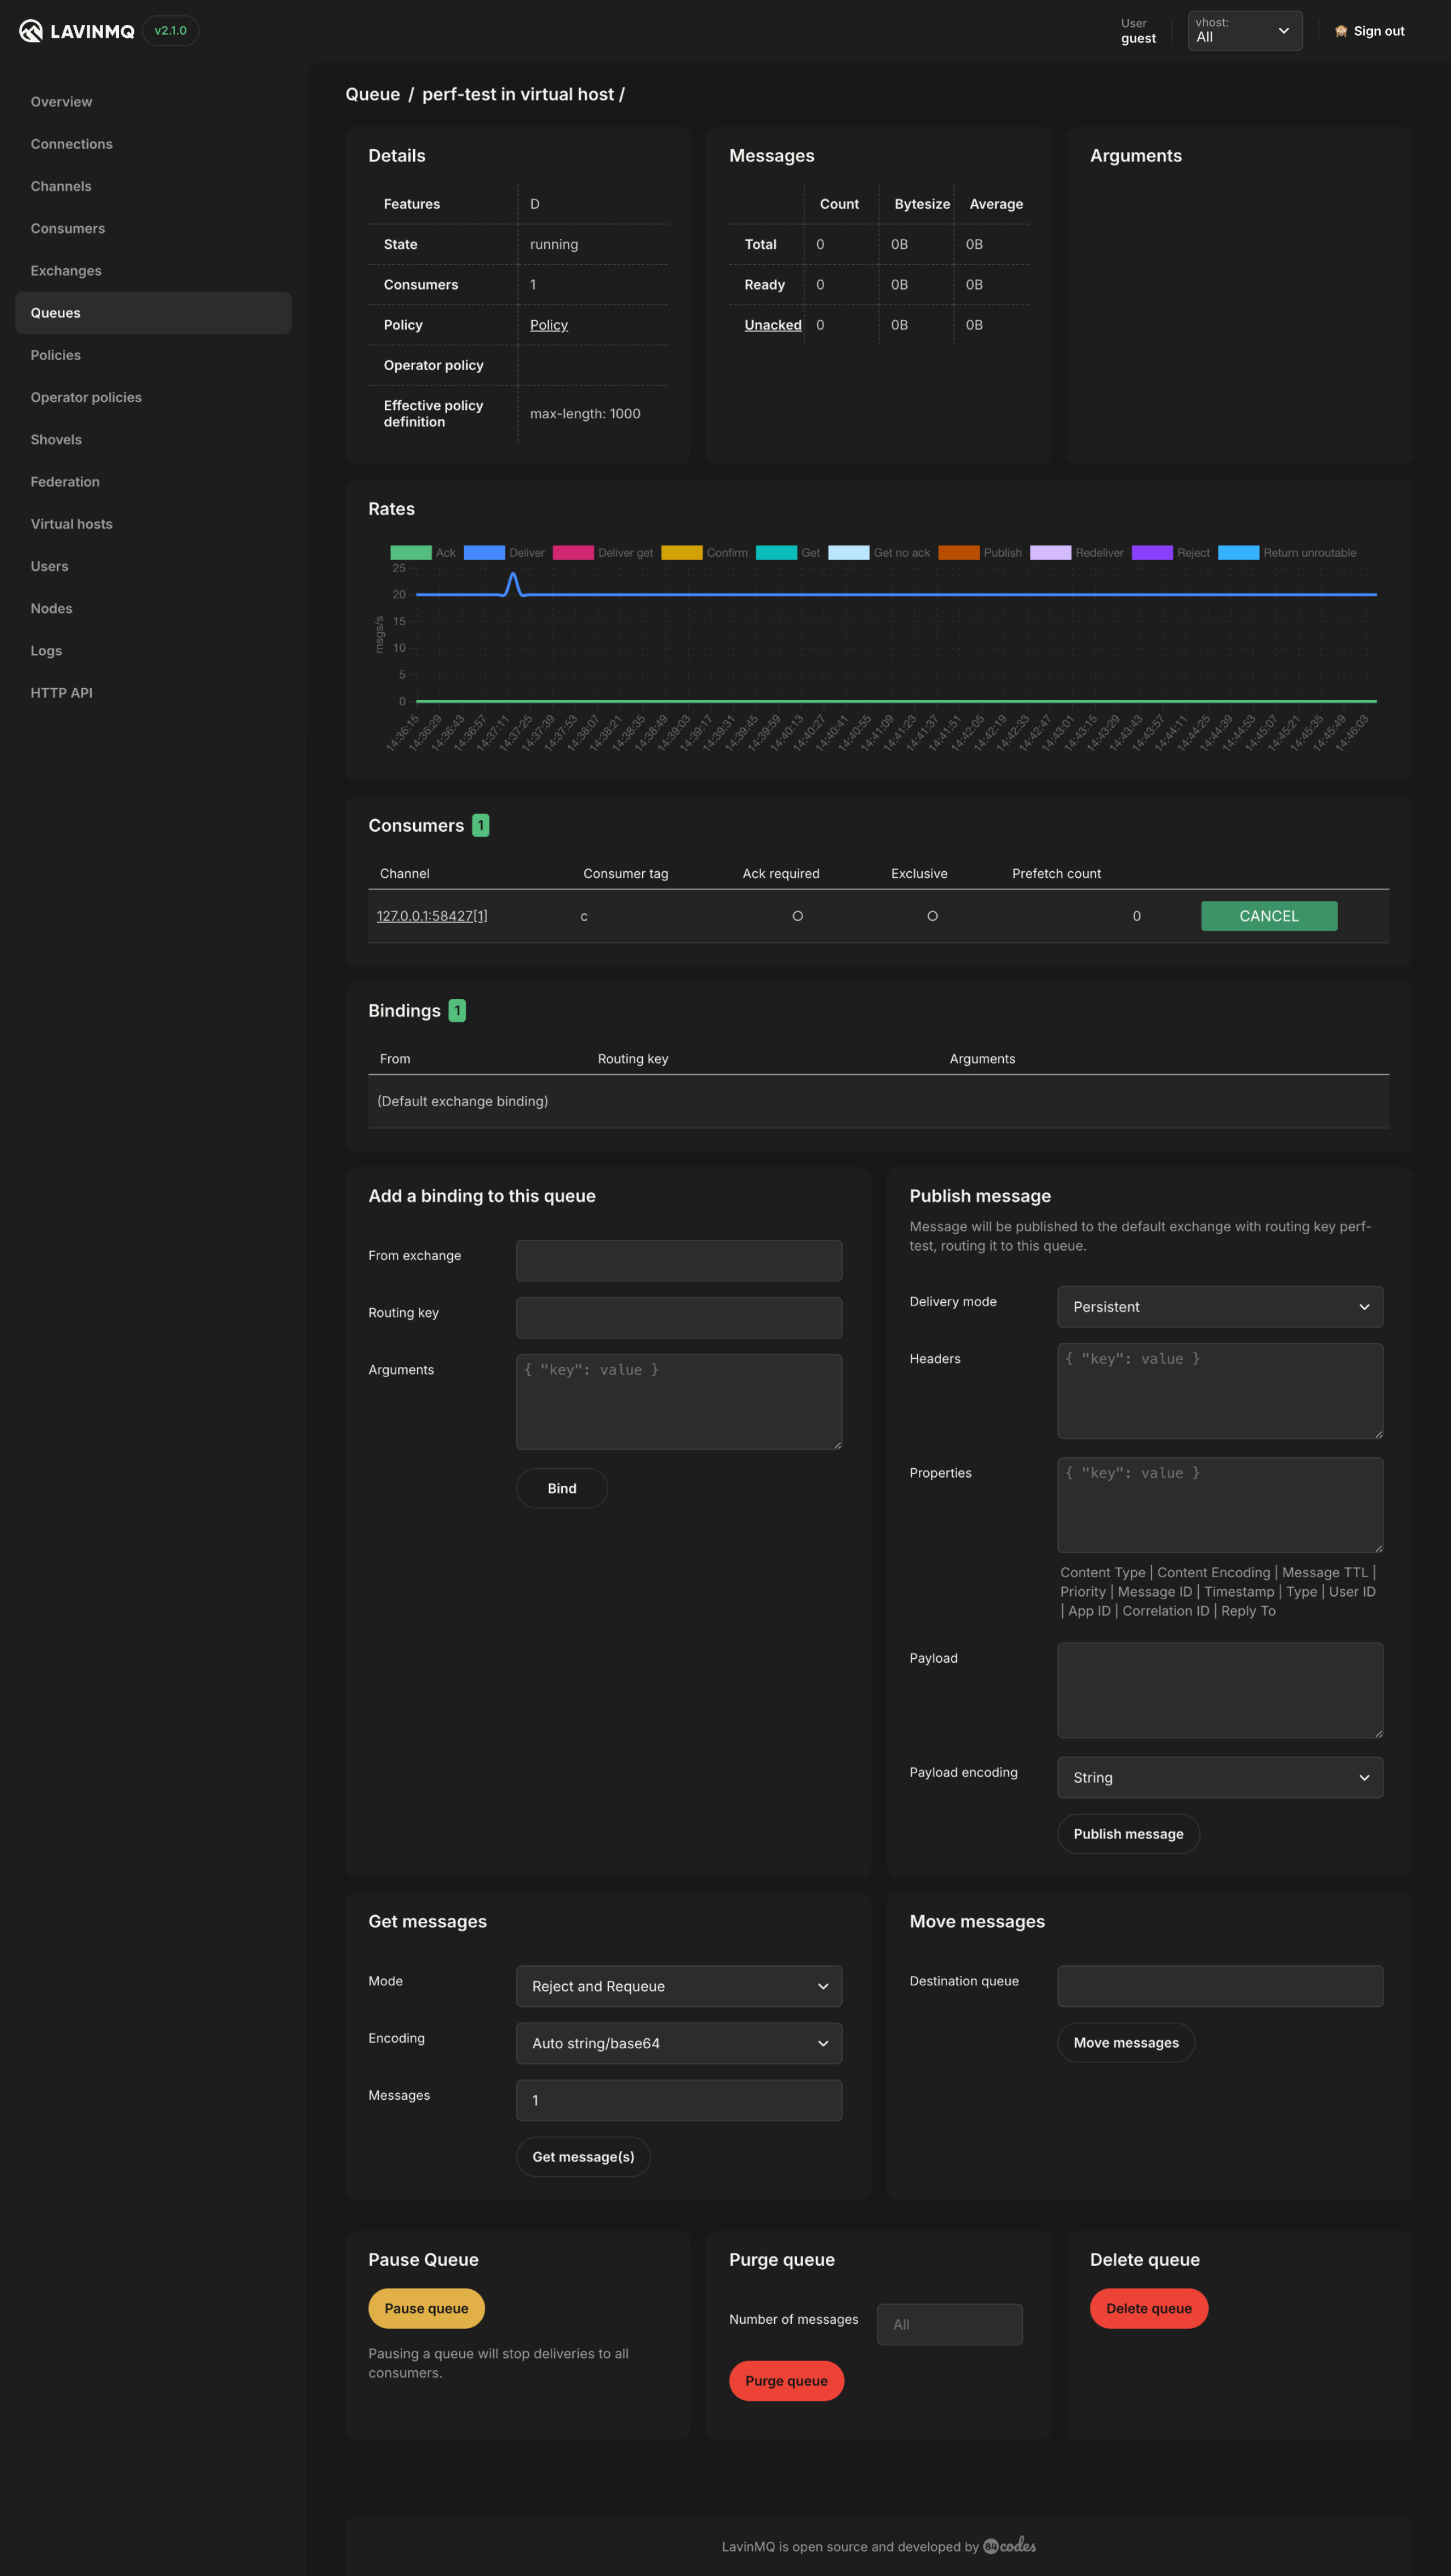
Clicking on the name of the queue gives a more detailed view. This view will show details for a specific queue, message stats, arguments, message rates, consumers, and bindings. It will give you options to add a binding to the queue, publish a message, get messages, move messages, pause, delete and purge.
From here you can also drill down further to exchanges and consumer channels as well as cancel a consumer and delete a binding.
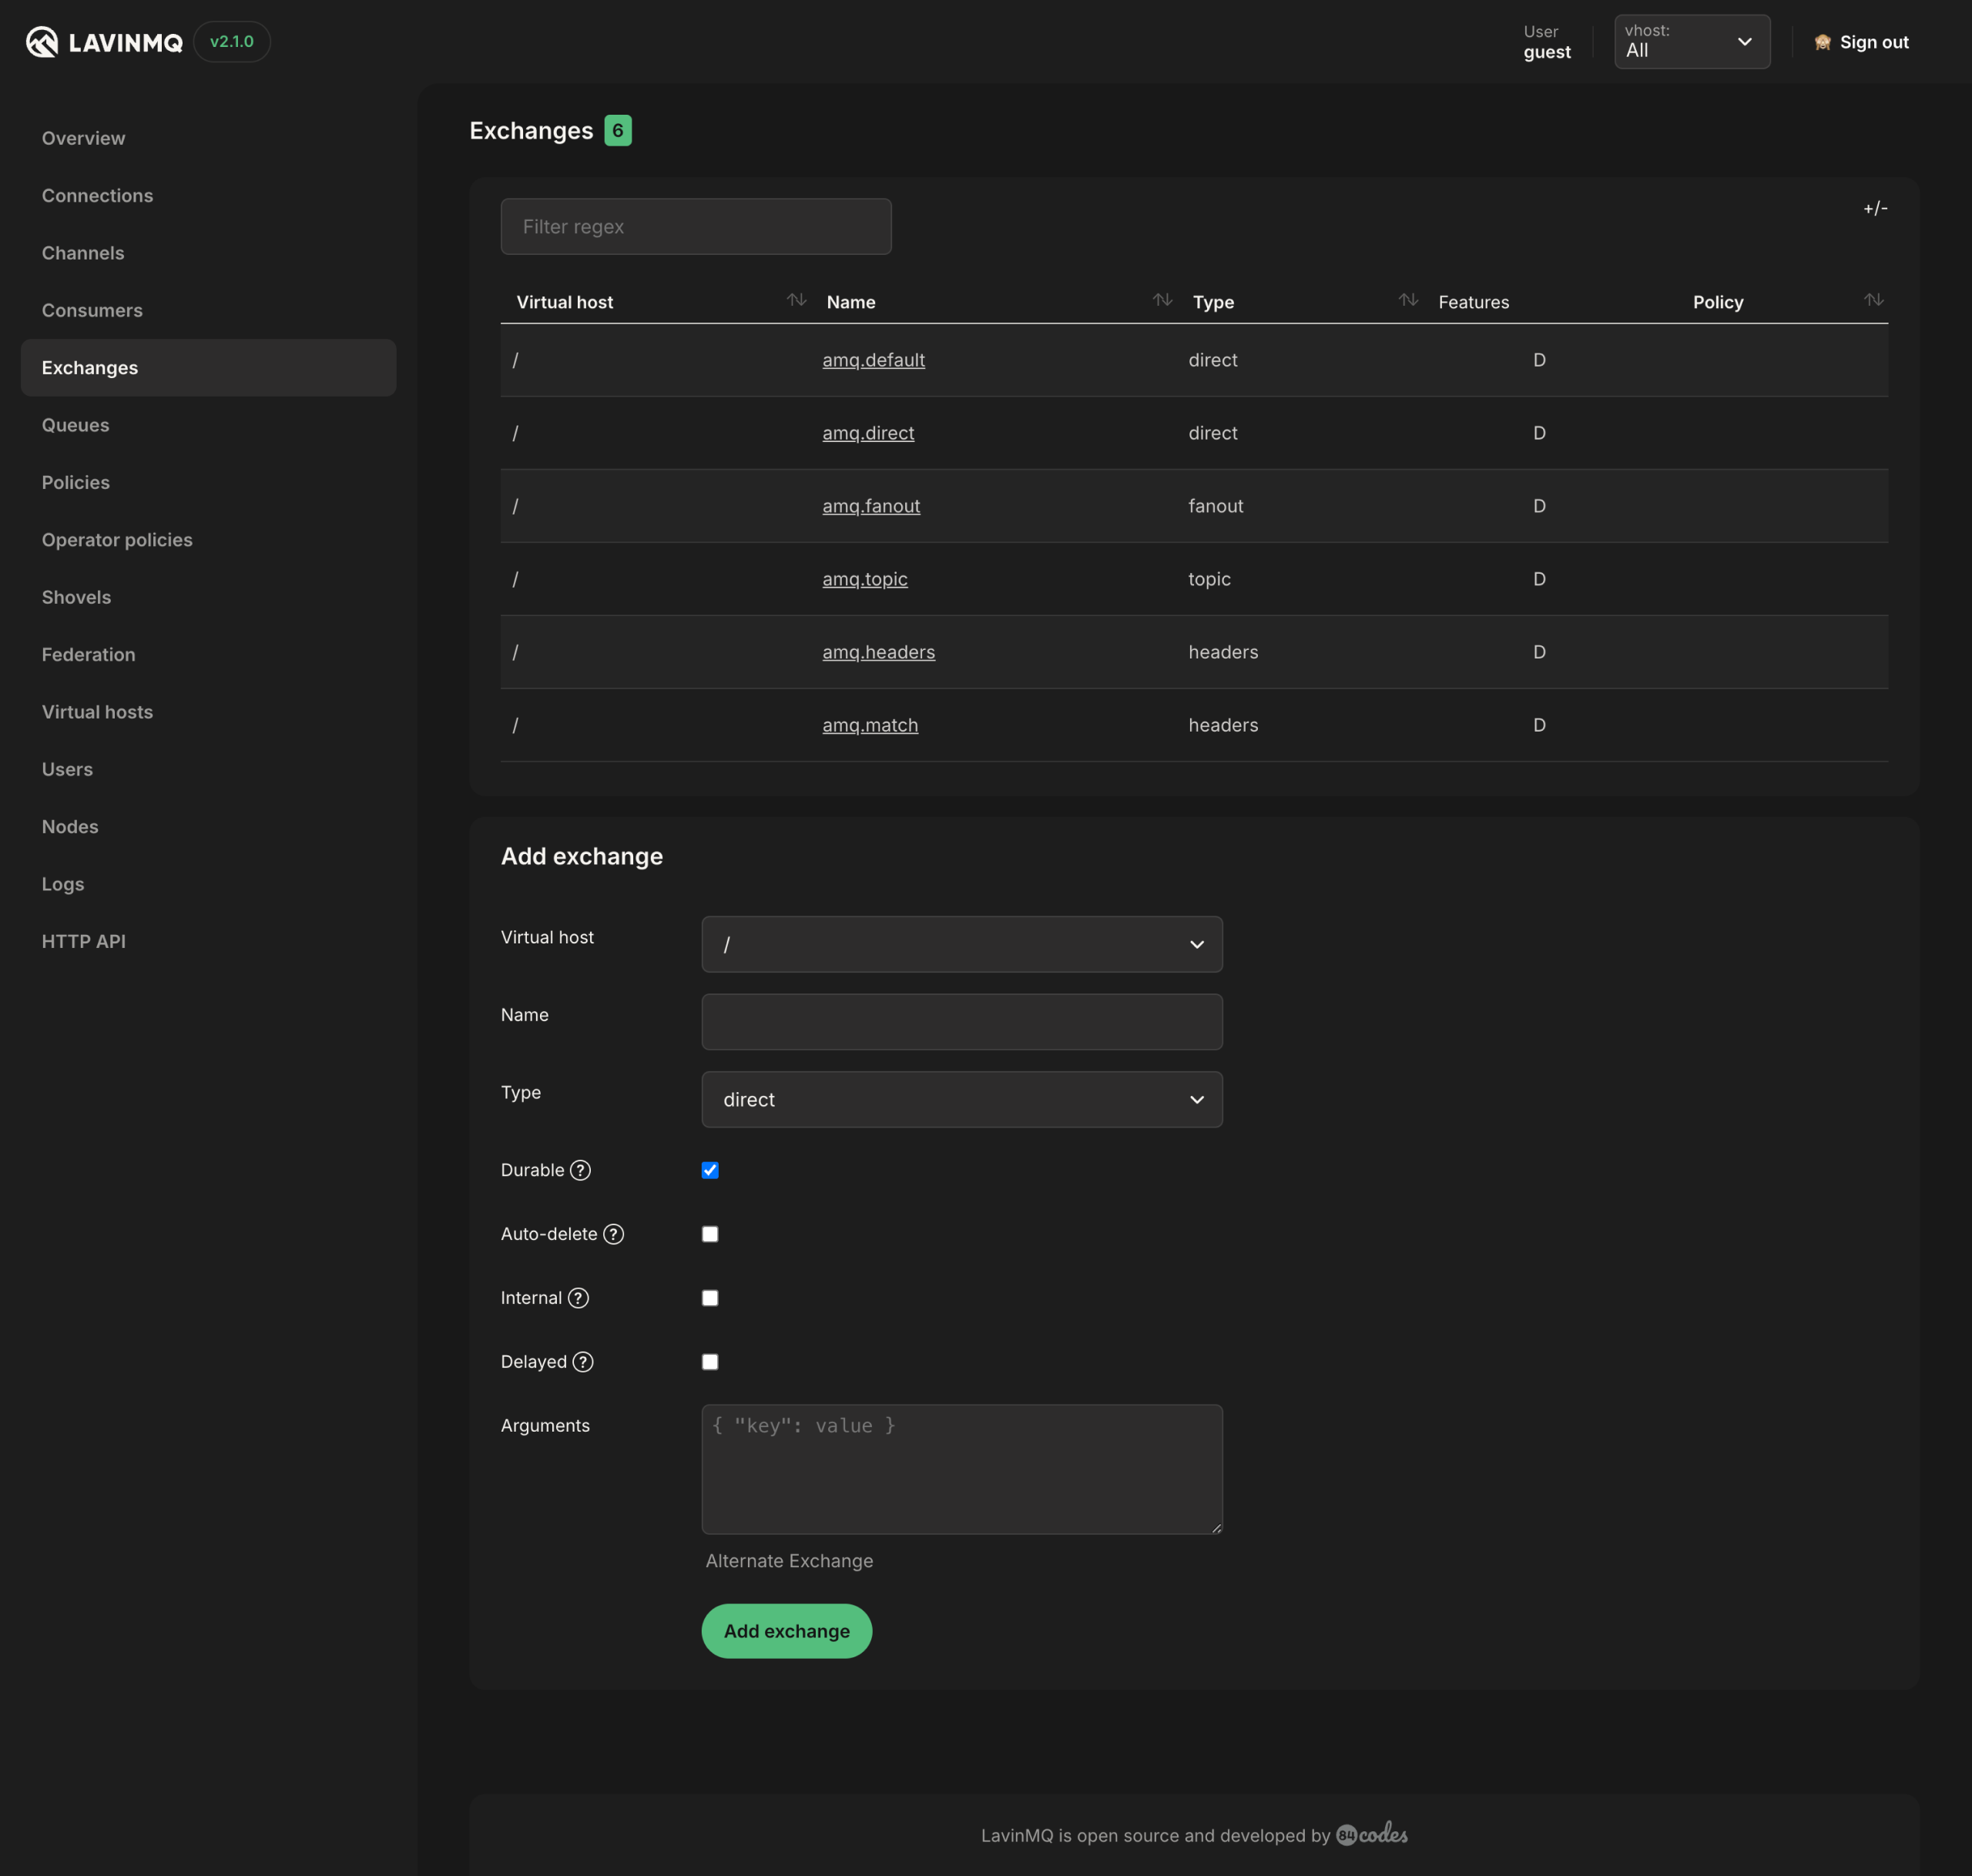
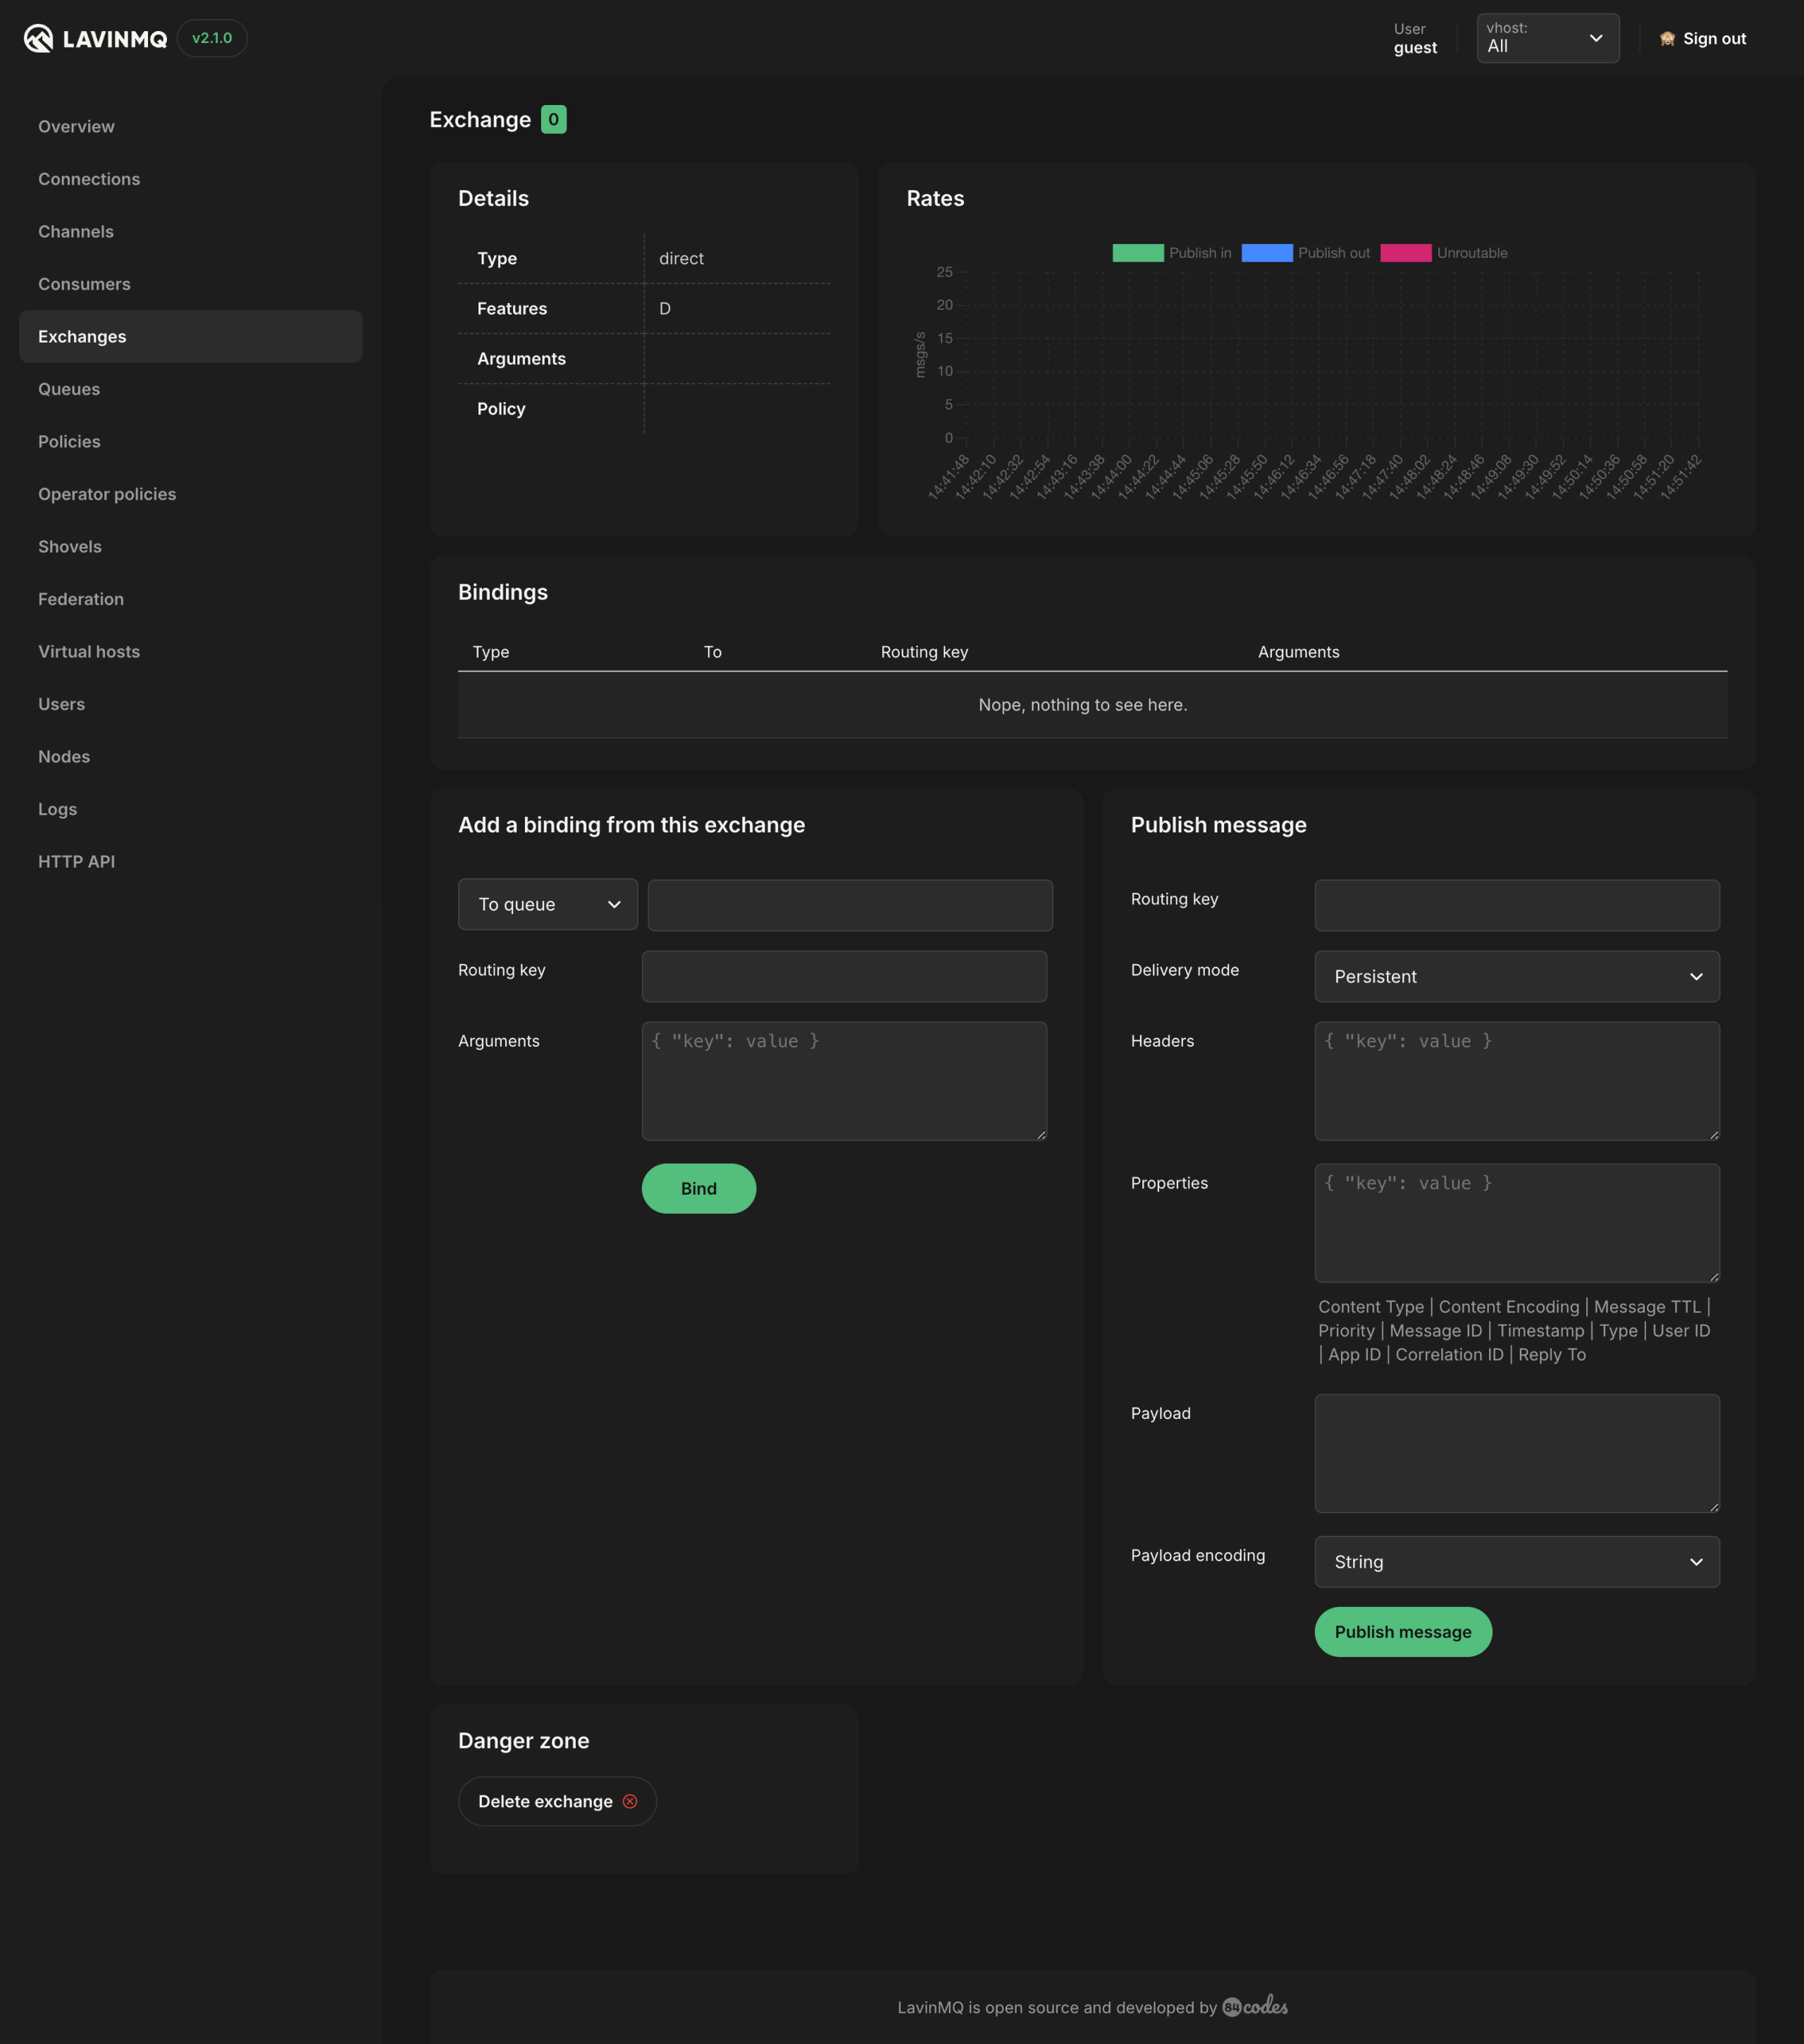
Exchanges
The Exchanges tab shows a detailed view of all exchanges. The table includes the columns:
- Virtual host: the vhost where an exchange operates.
- Name: the name of an exchange.
- Type: the exchange type such as direct, topic, headers, fanout.
- Features: Show the parameters for the exchange (e.g. D stand for durable, and AD for auto-delete)
- Policy: policy applied to the exchange.
Features and types can be specified when the exchange is created. In this list there are some amq.* exchanges that are created by default. You can also add an exchange from this view.
Clicking on the name of the exchange gives a more detailed view. This view shows details for a specific exchange, message rates, and bindings. It will give you options to add a binding from this exchange, publish a message, and delete the exchange.
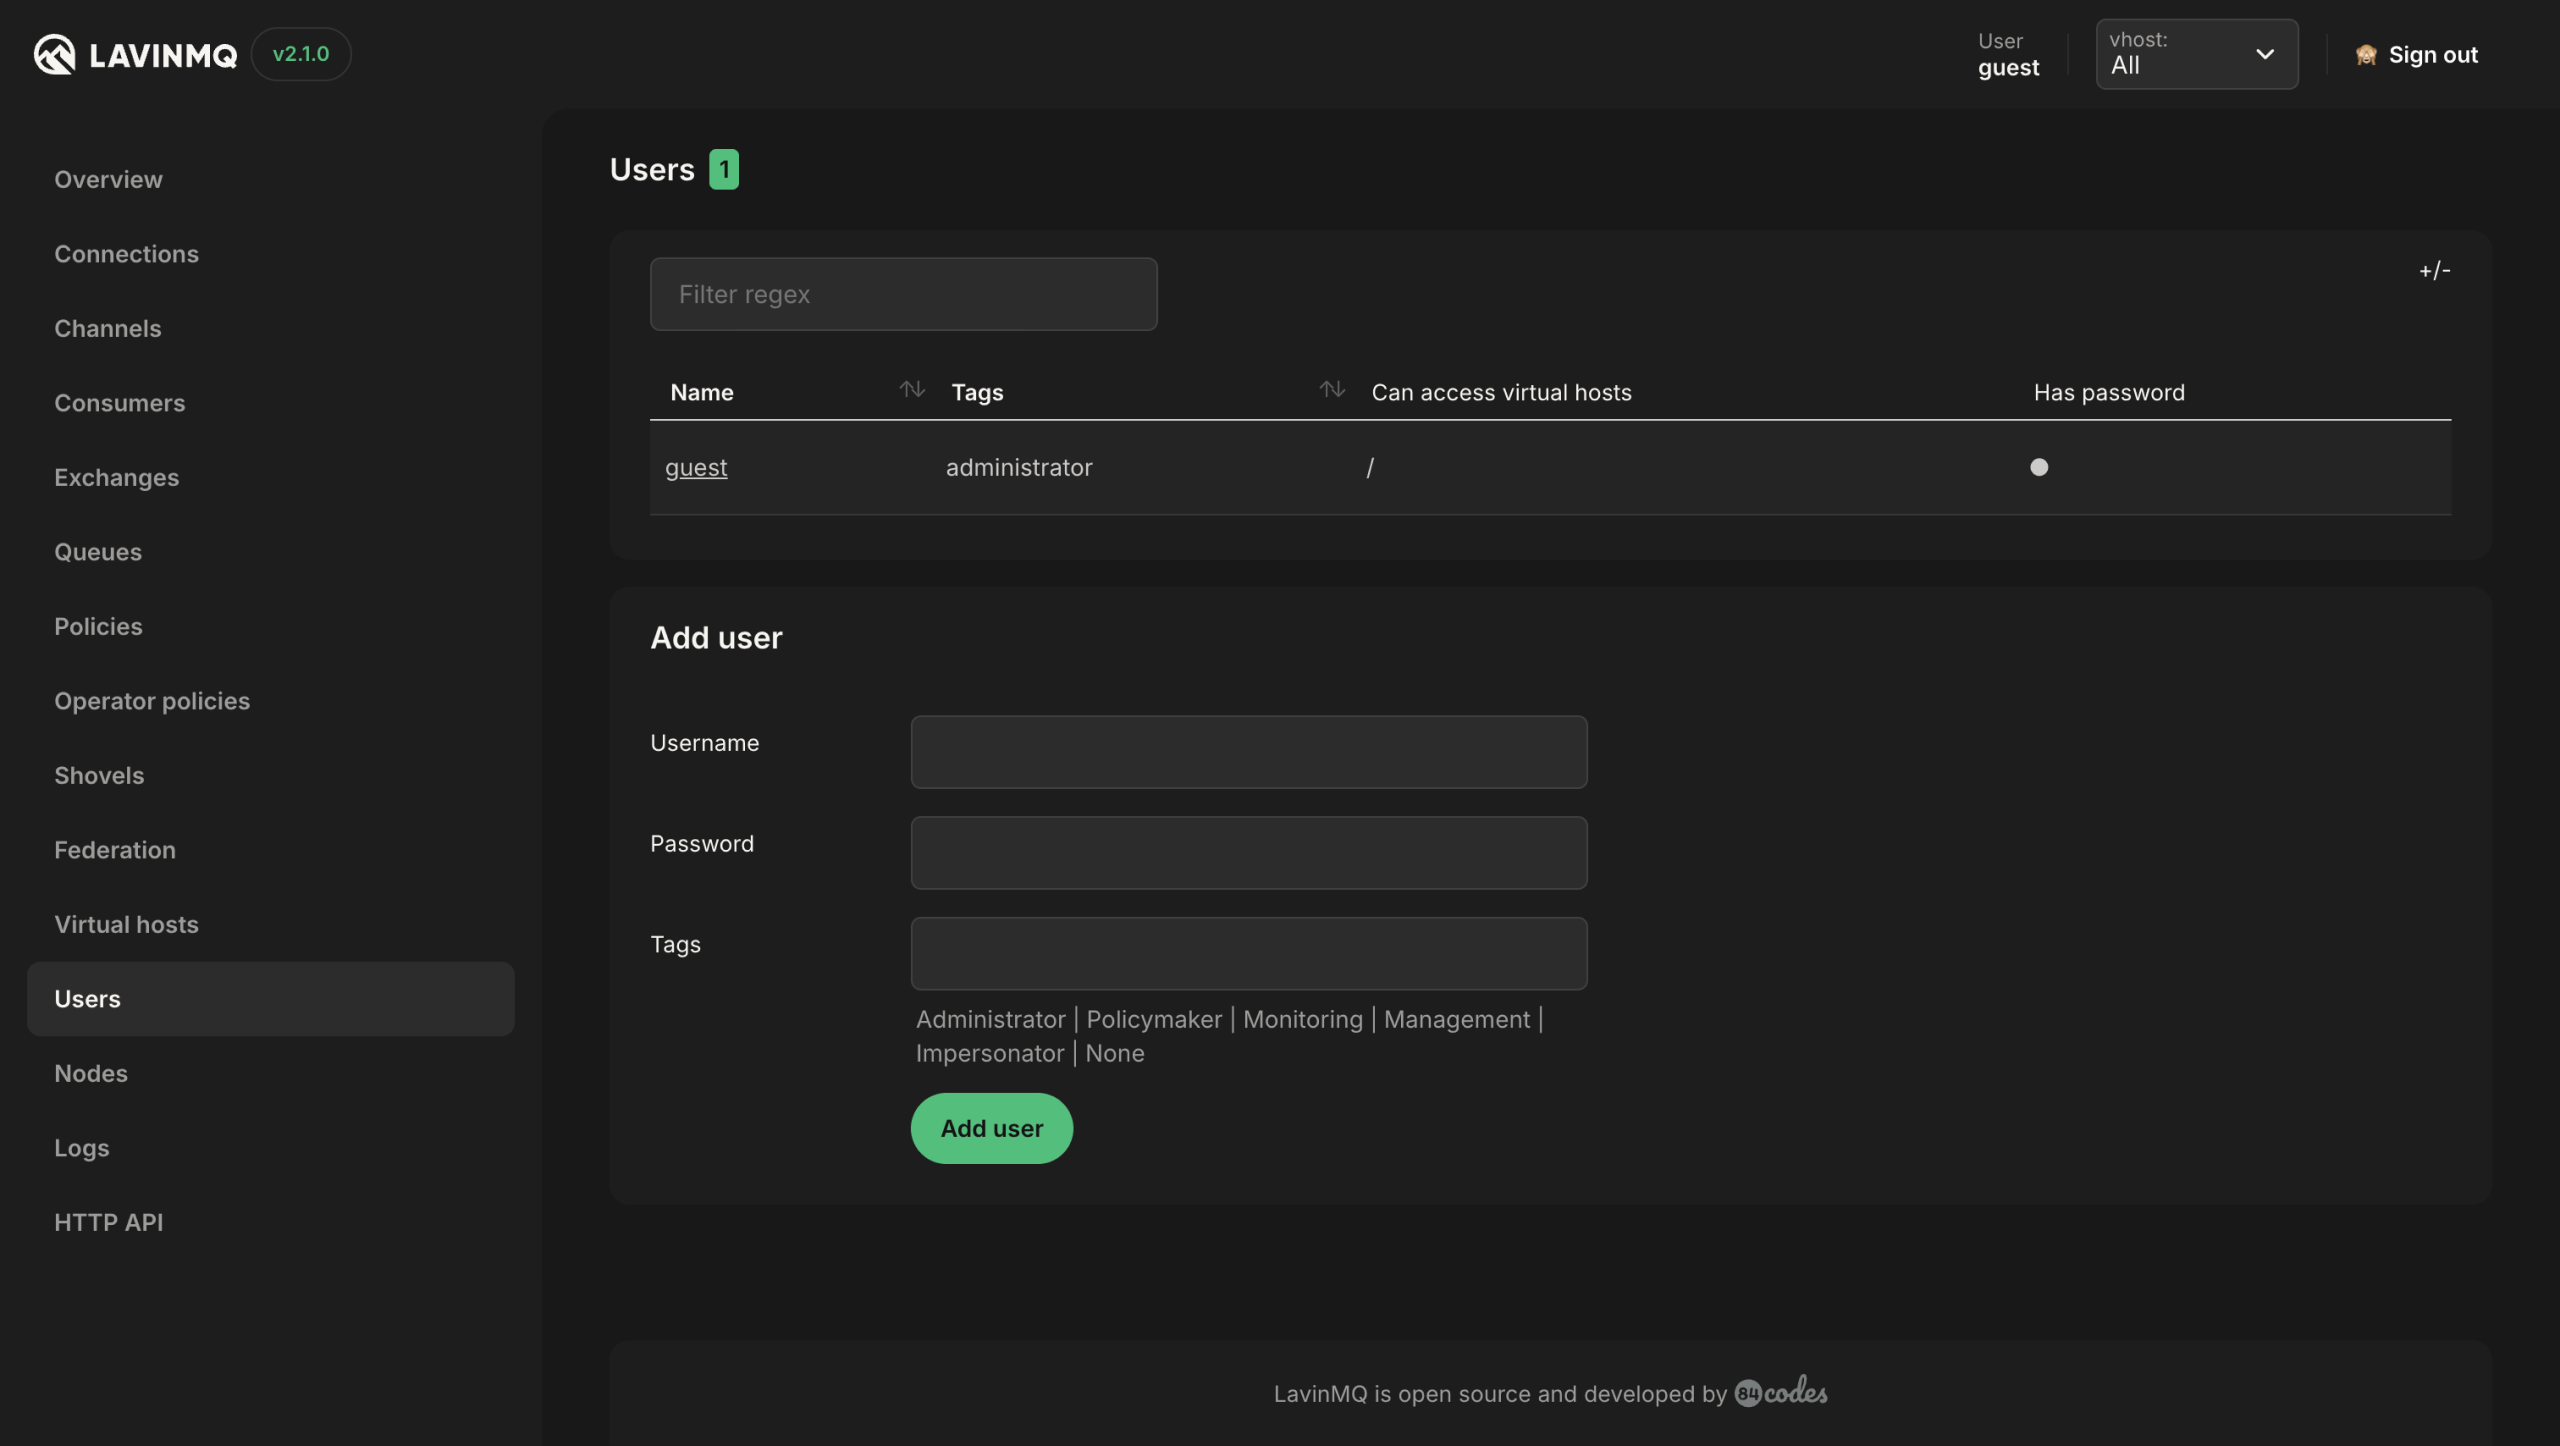
Users
The Users tab shows a detailed view of all users. The table includes the columns:
- Name: name of the user.
- Tags: tags assigned to the user.
- Can access virtual hosts: list of vhosts the user has access to
- Has password: boolean for if the user has a password or not.
Users can be added from the management interface and assigned permissions using tags and vhosts.
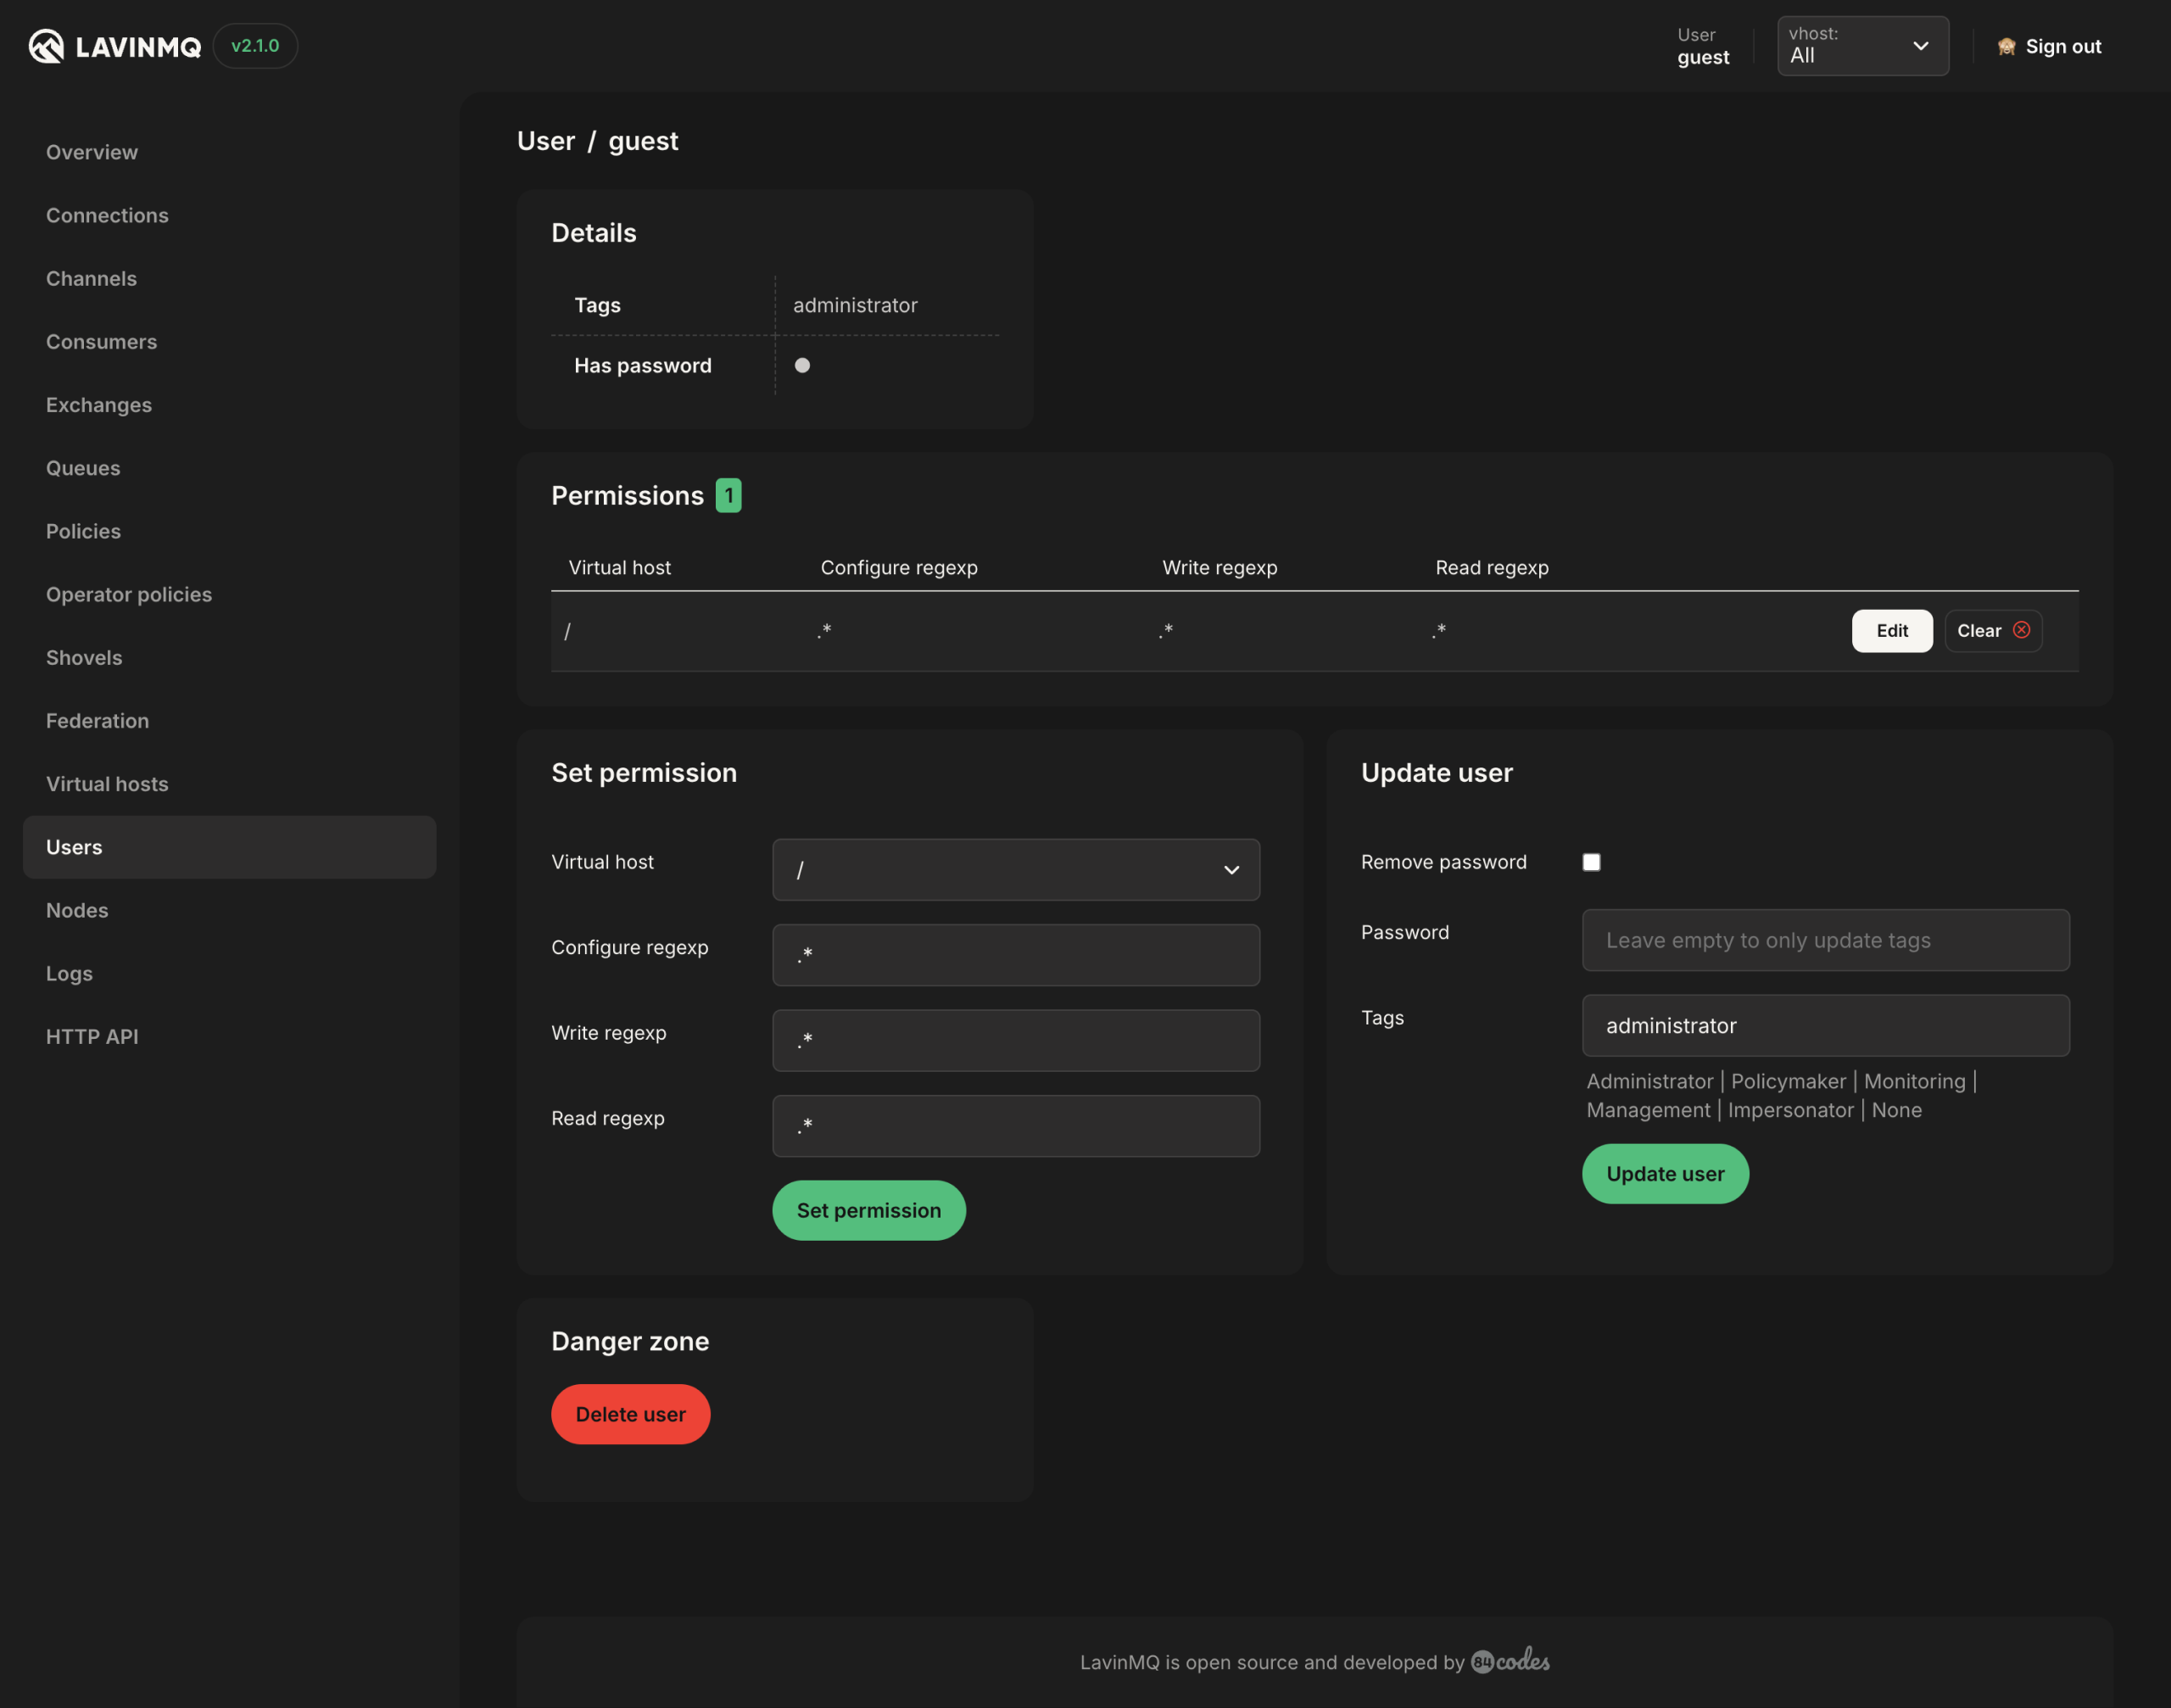
Create a user in LavinMQ Management Interface
First, create a user with a password and permission tags, then click on the name of the user to set detailed permissions. From the detailed view you can set missions to a specific vhost, and the subsequent read, write and configure access the user should have to that vhost. Delete permissions by clicking the Clear button. Or you can update a user’s password and remove tags as well as delete the user.
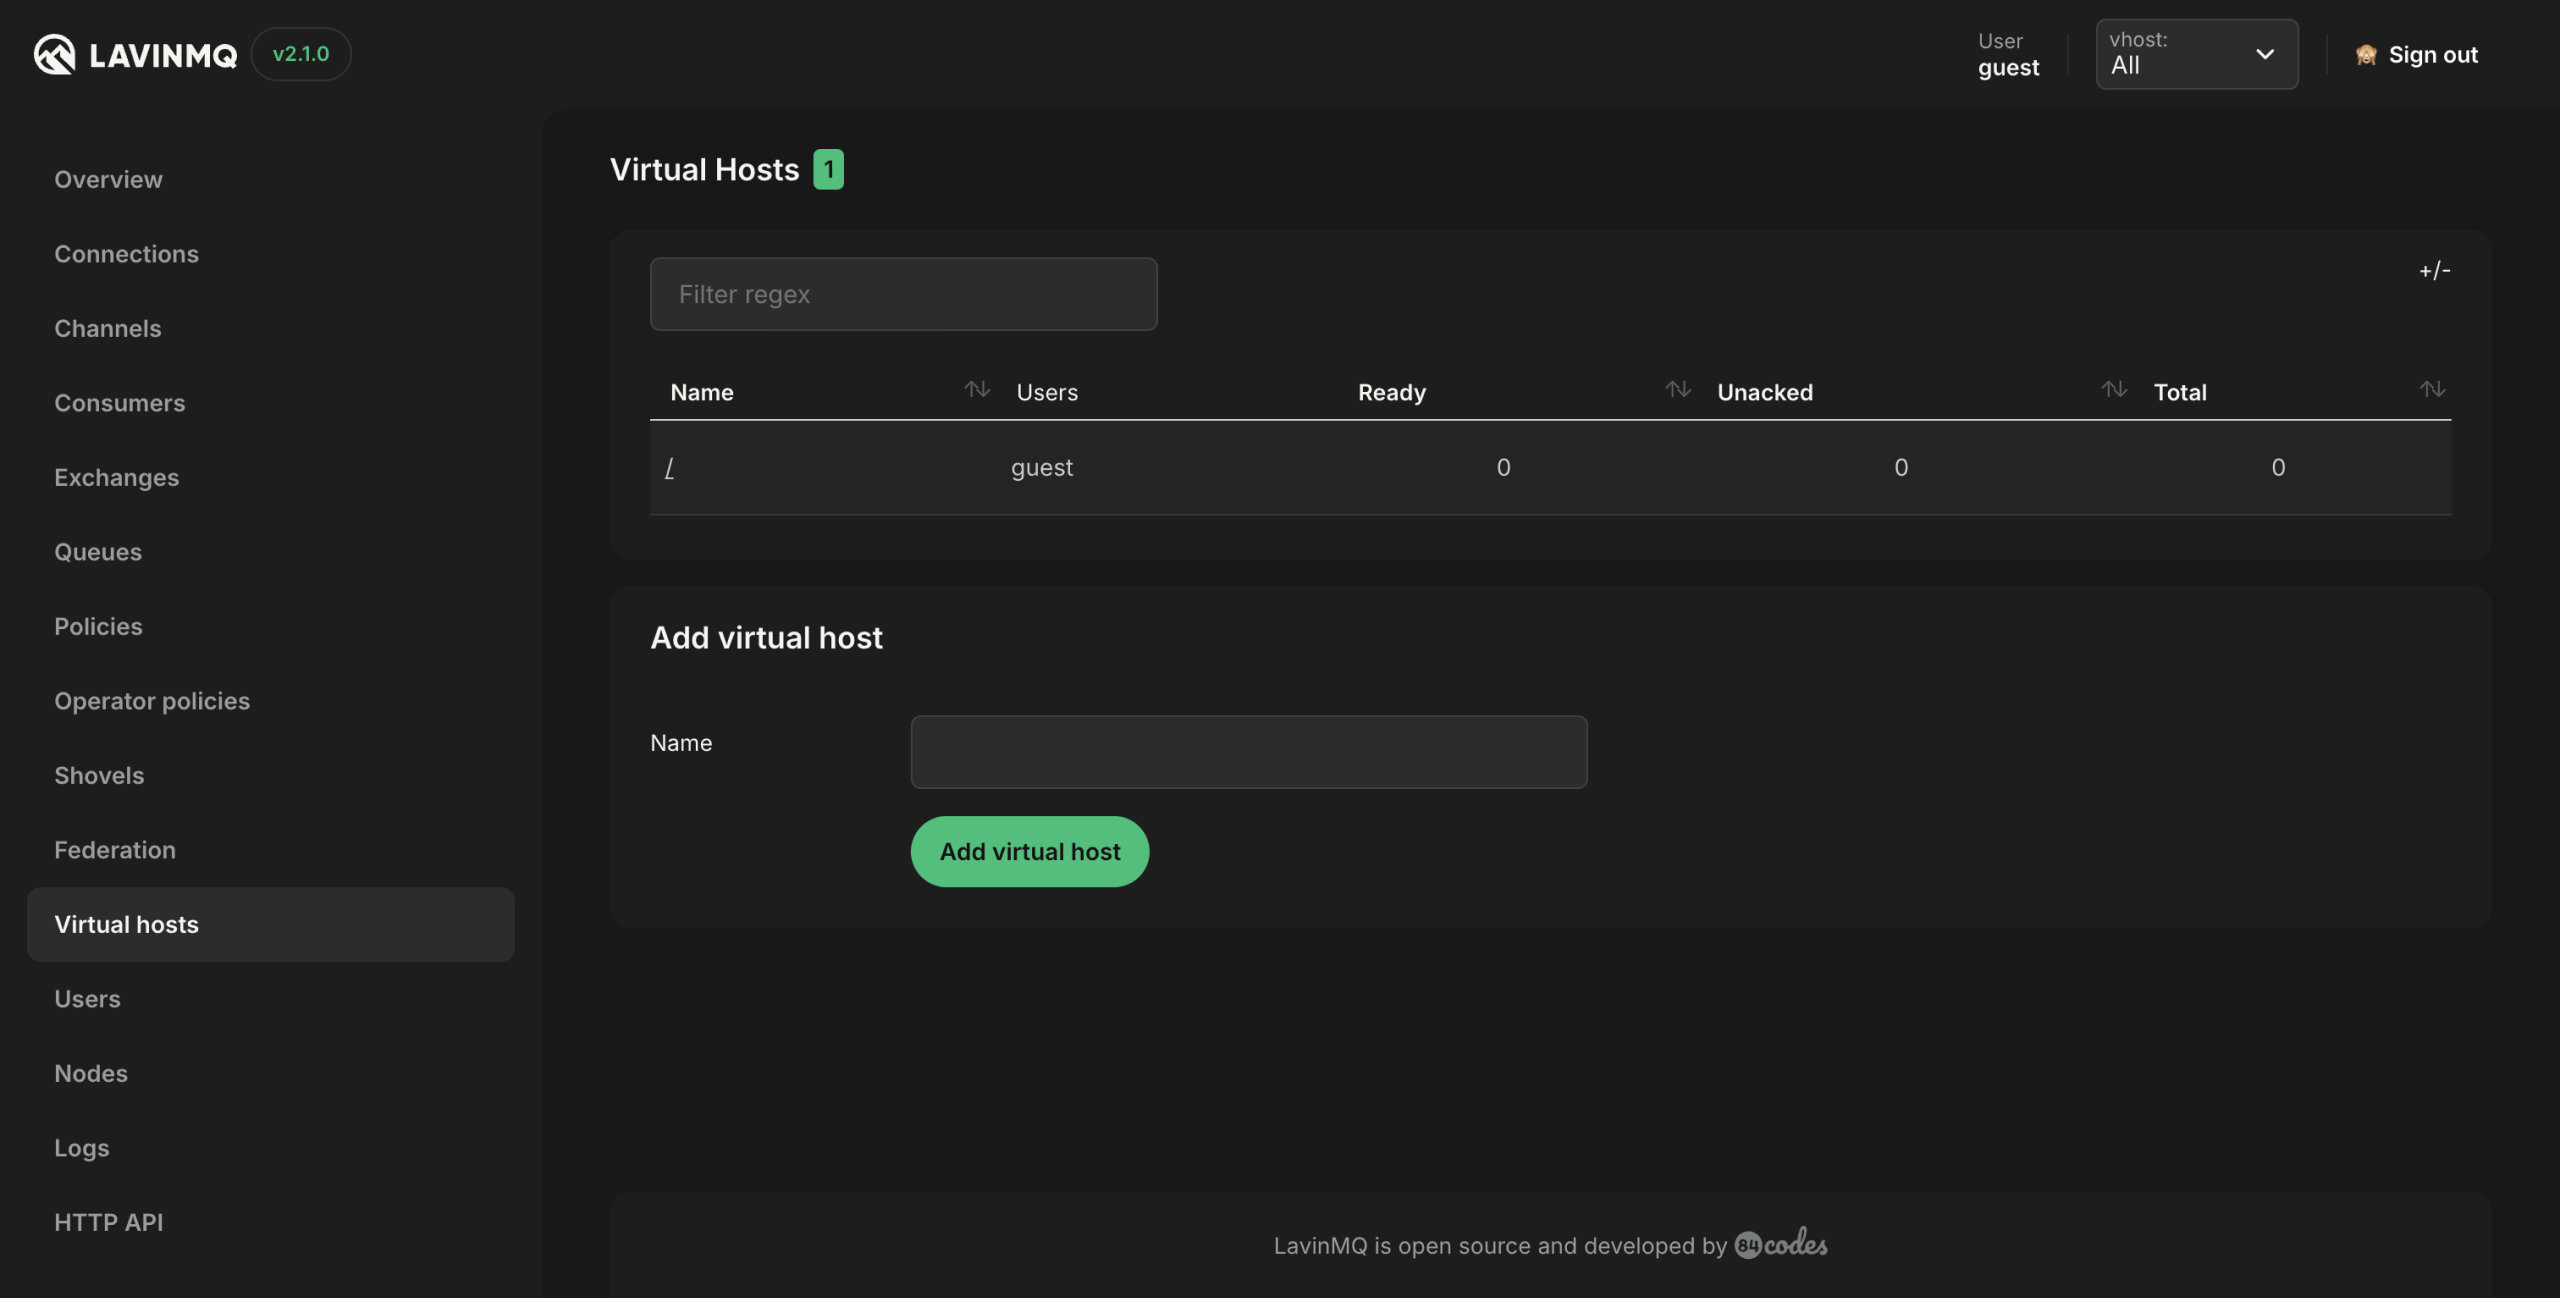
Virtual hosts
Virtual hosts (vhosts), are like a virtual machine for a physical server, allowing for multiple secure application operations through virtual rather than physical separation. As the separation is virtual, it is important to remember that the vhosts are not physically separated from each other and therefore they might affect each other’s performance. Vhosts do not share exchanges or queues between them, and users, policies, etc. are unique to each vhost. The Virtual hosts’ tab shows a detailed view of all vhosts. The table includes the columns:
- Name: name of the virtual host.
- Users: users having access to the virtual host.
- Ready: number of messages in a ready state.
- Unacked: number of messages in unacked state.
- Total: total number of messages in ready and unacked state.
You can create a vhost from this view, or click on the name of an already existing vhost to show more details.
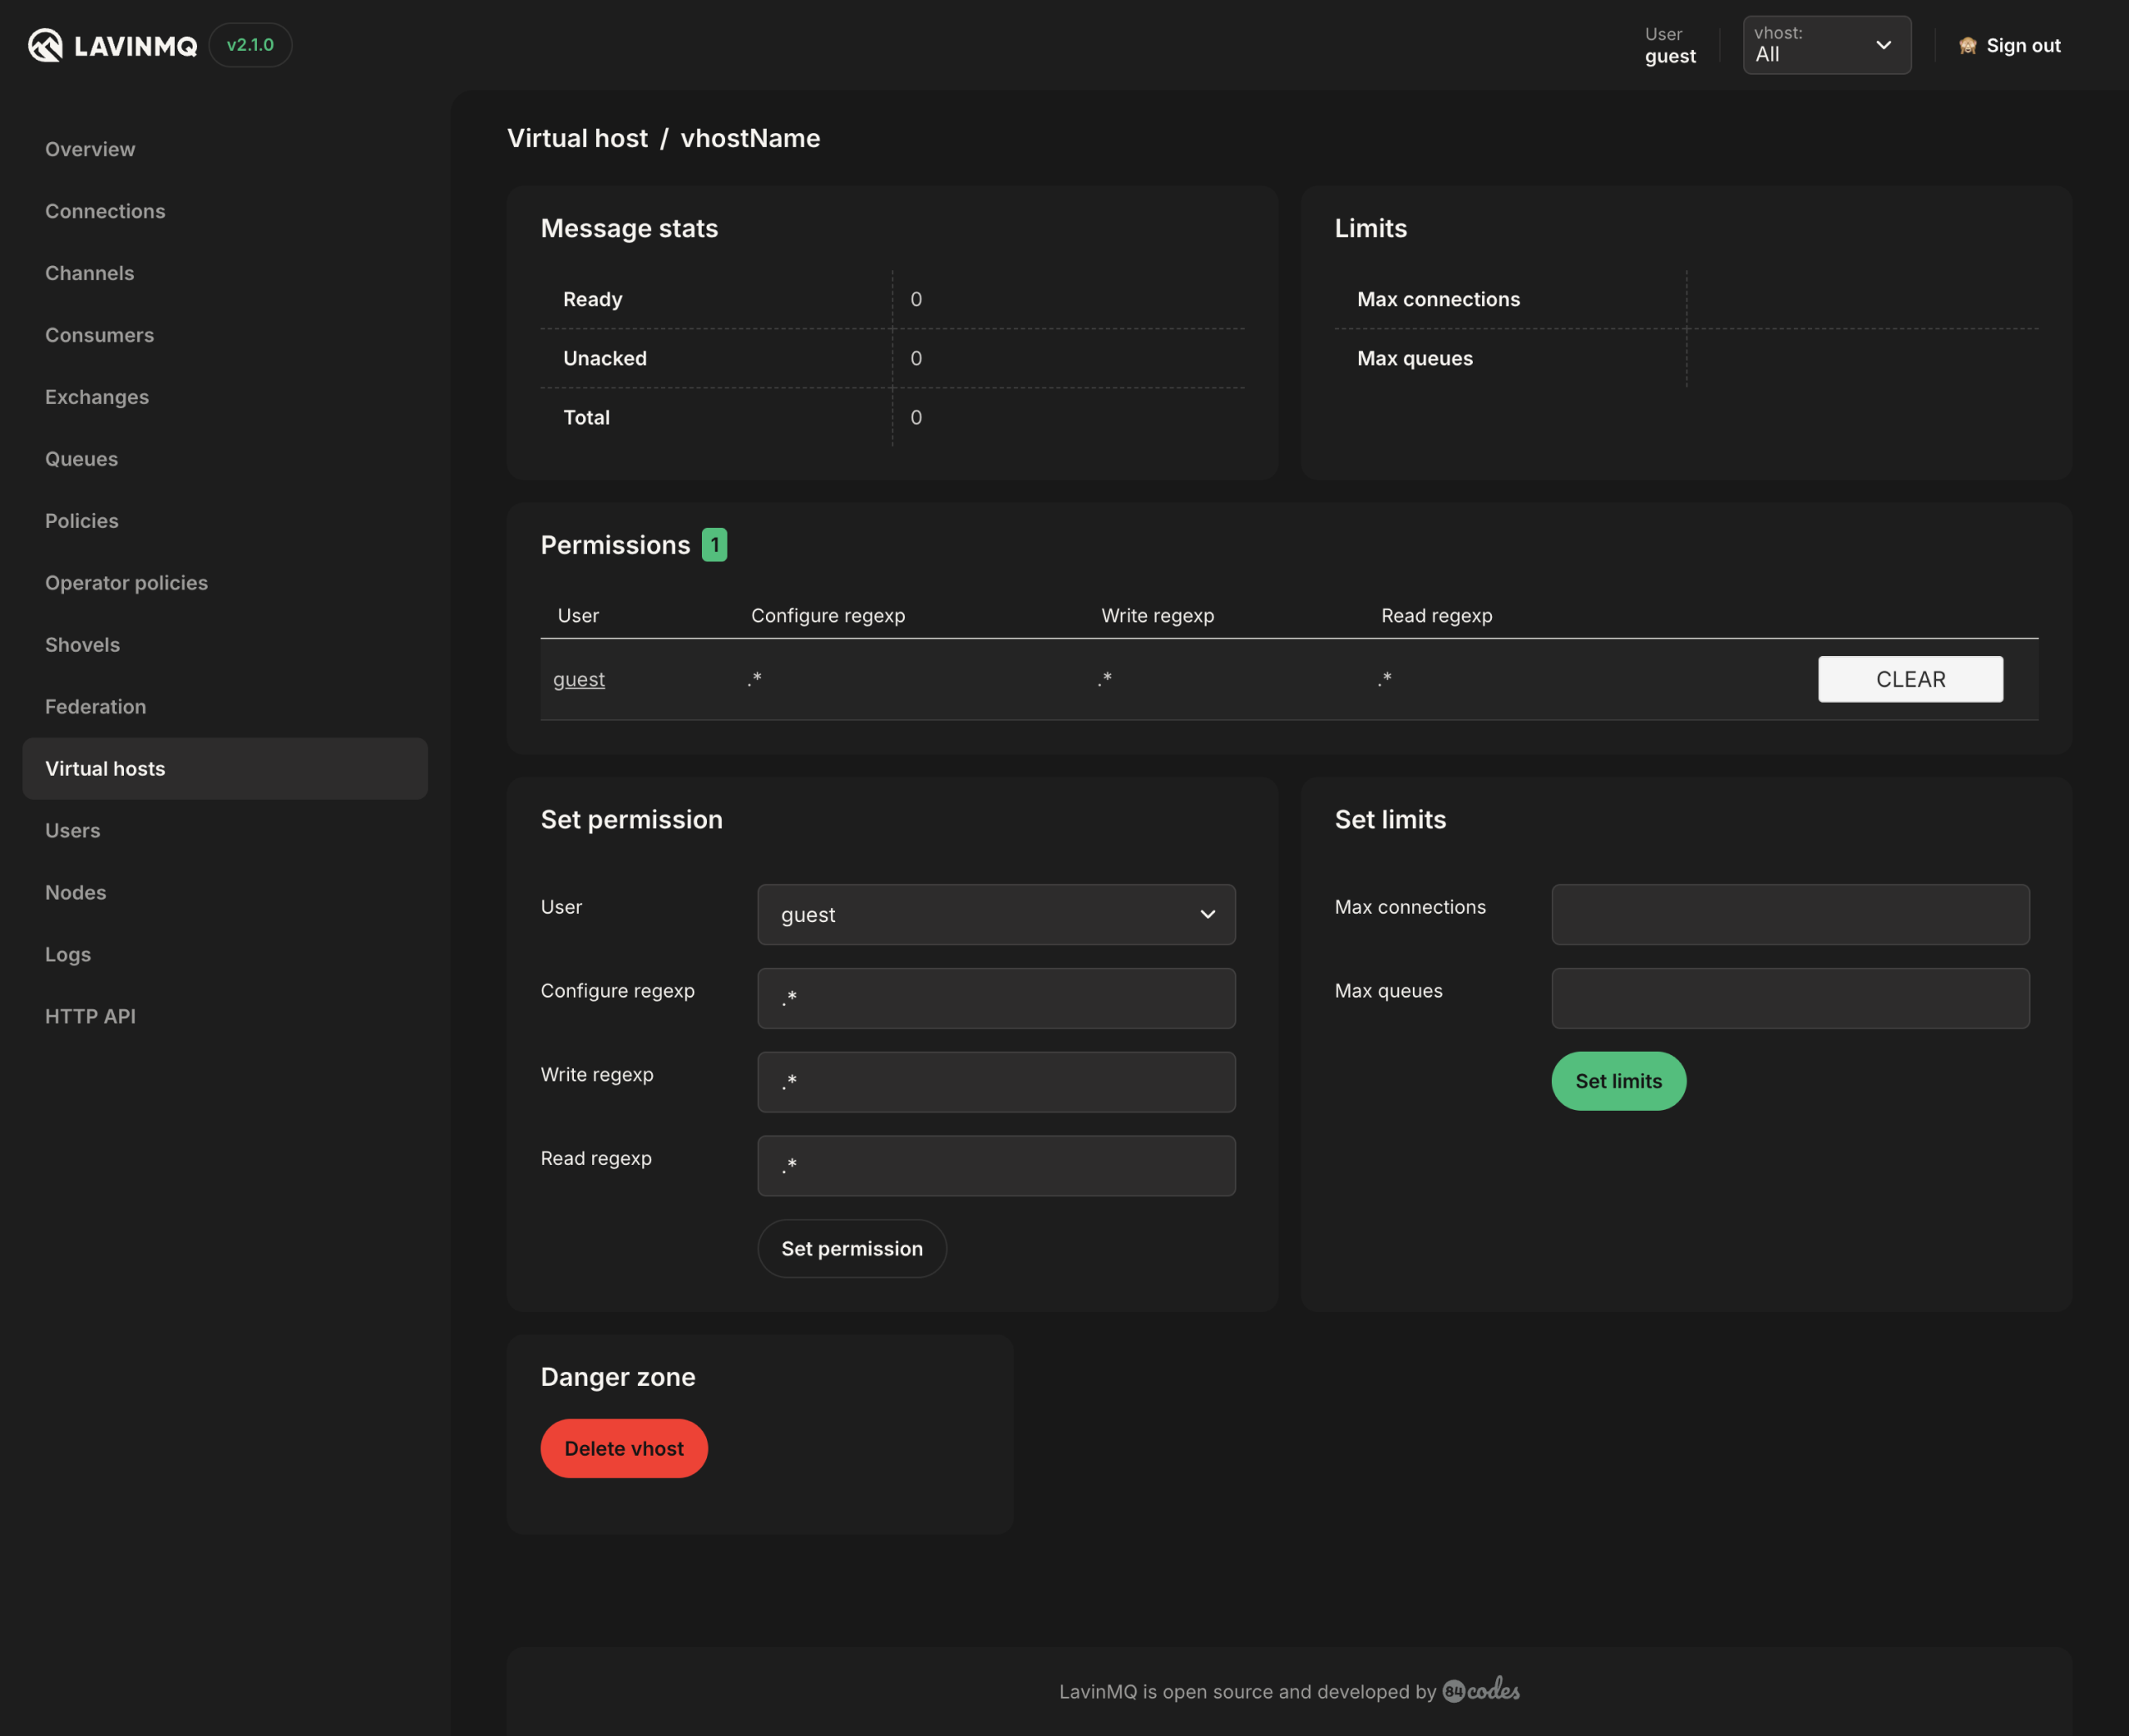
Vhost Limits API
Configure resource limits per virtual host using the HTTP API to prevent runaway resource consumption and connection leaks:
- Set limit:
PUT /api/vhost-limits/{vhost}/{name}with JSON body containing limit definitions. Name should be eithermax-connectionsormax-queues- Example:
{"value": 1000}
- Example:
- View limits:
GET /api/vhost-limits/{vhost}includes current limits in the response - Remove limit:
DELETE /api/vhost-limits/{vhost}/{name}
These limits help maintain system stability by controlling possible queue or connection leaks on a per-vhost basis.
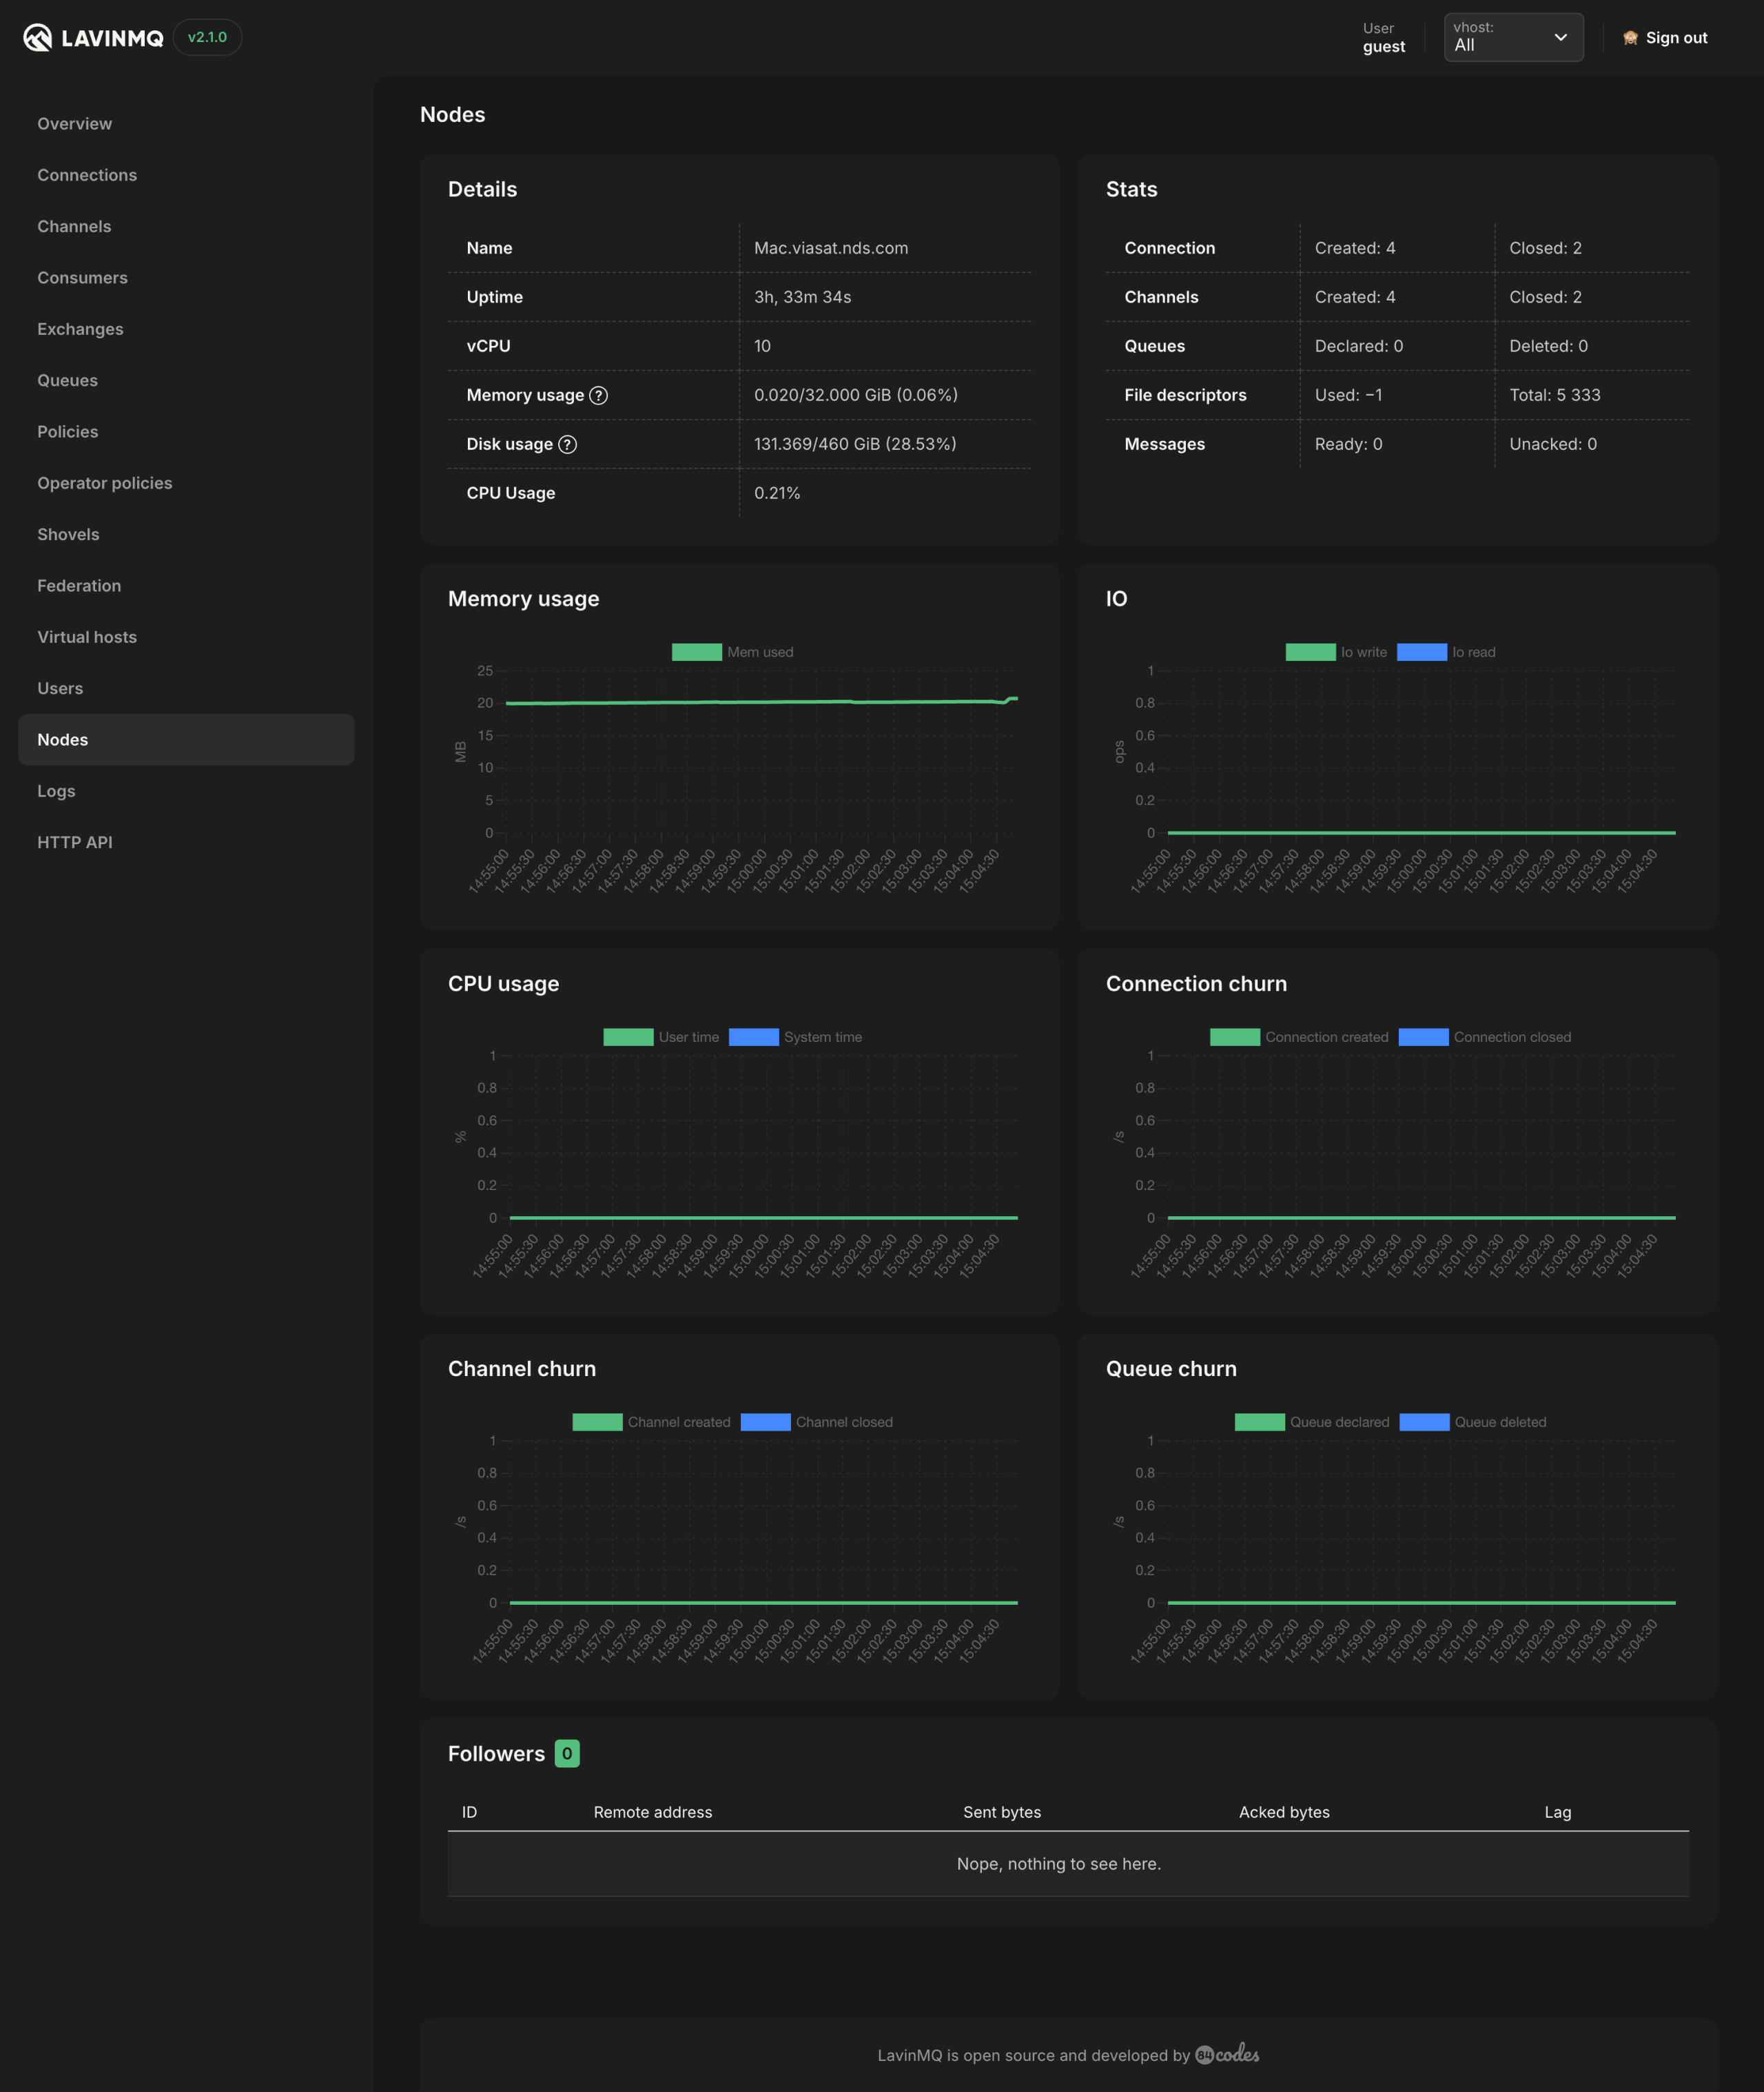
Nodes
The Nodes tab shows information about the server on which LavinMQ is running, such as:
- Server details (name, uptime, number of cores, memory usage, average CPU usage, and disk usage)
- Stats (connections, channels, queues, file descriptors)
- Memory usage
- IOPS (read and write)
- CPU usage (user, system, and total)
- Connection churn (created and closed)
- Channel churn (created and closed)
- Queue churn (declared and deleted)
Policies
Policies are used to control arguments for groups of queues and exchanges. A policy can match one or several queues and exchanges based on a regex pattern. The Policies tab shows a detailed view of all policies. The table includes the columns:
- Virtual host: the vhost where a policy operates.
- Name: name of the policy.
- Pattern: regular expression for matching resources where the policy will apply.
- Apply to: which types of objects the policy should apply to. Possible values are queues, exchanges, or all.
- Definition: the definition of the policy, as a JSON term.
- Priority: the priority of the policy as an integer. Higher numbers indicate greater precedence.
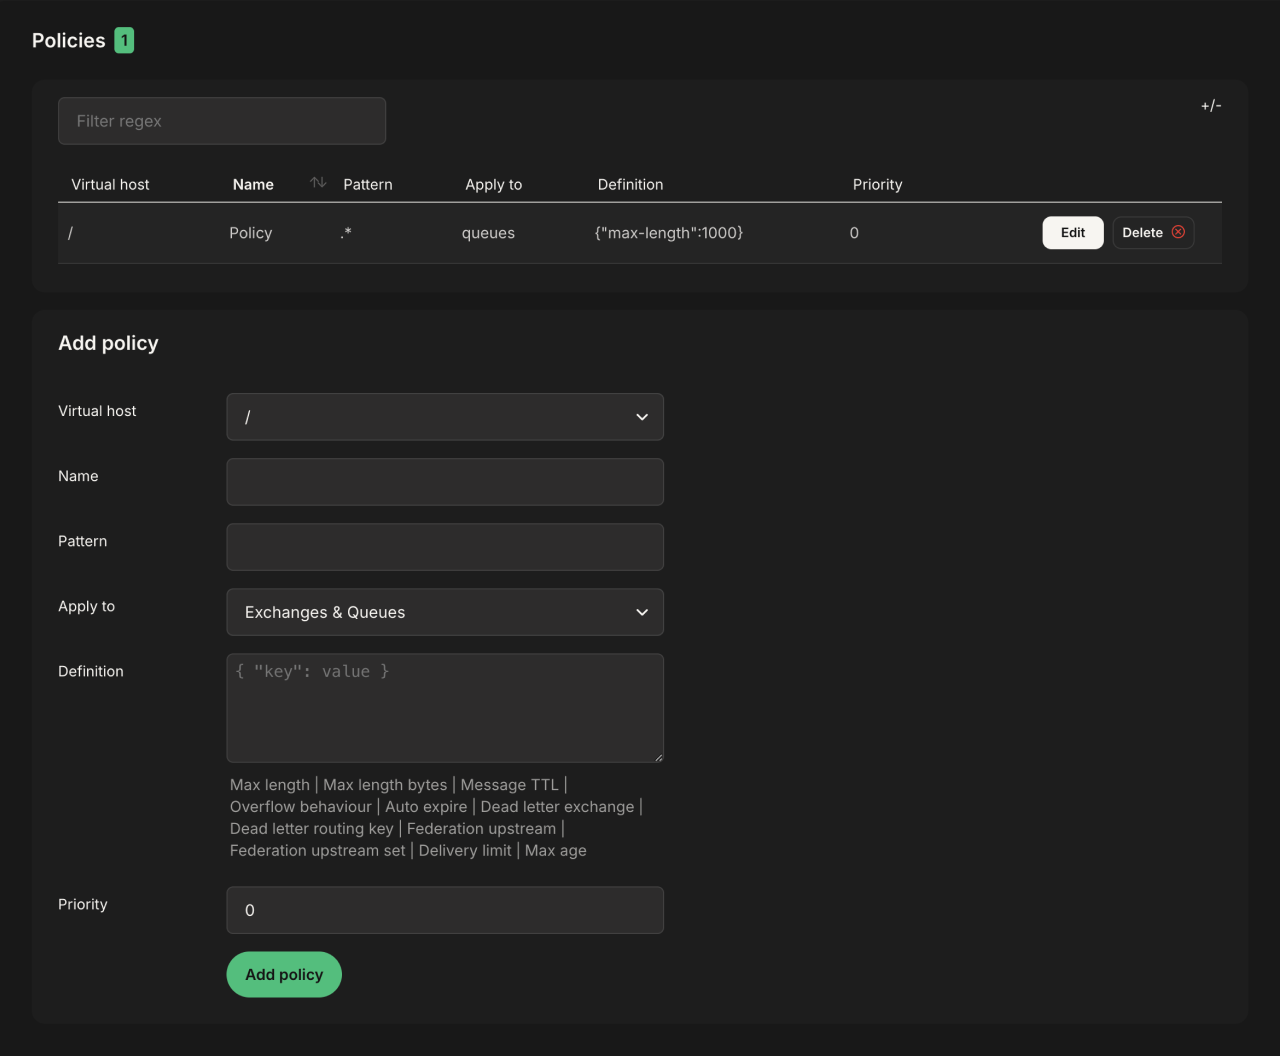
Create a policy
Create a policy by selecting the vhost where the policy should be applied, a name, a regex pattern for matching queues and/or exchanges, the definitions, and priority. The definitions field is where you define what arguments the queues and/or exchanges should get, in JSON format. Click on the definition names below the definition field to get an explanation and populate the field. Make sure you change the word “value” to the value you want to apply. Only one policy can be applied to a queue and/or exchange at a certain time, so here is where the priority comes in, i.e. the policy with the greatest priority applies. To apply several definitions to one queue and/or exchange, create a policy with multiple definitions. This view is also where a policy can be deleted.
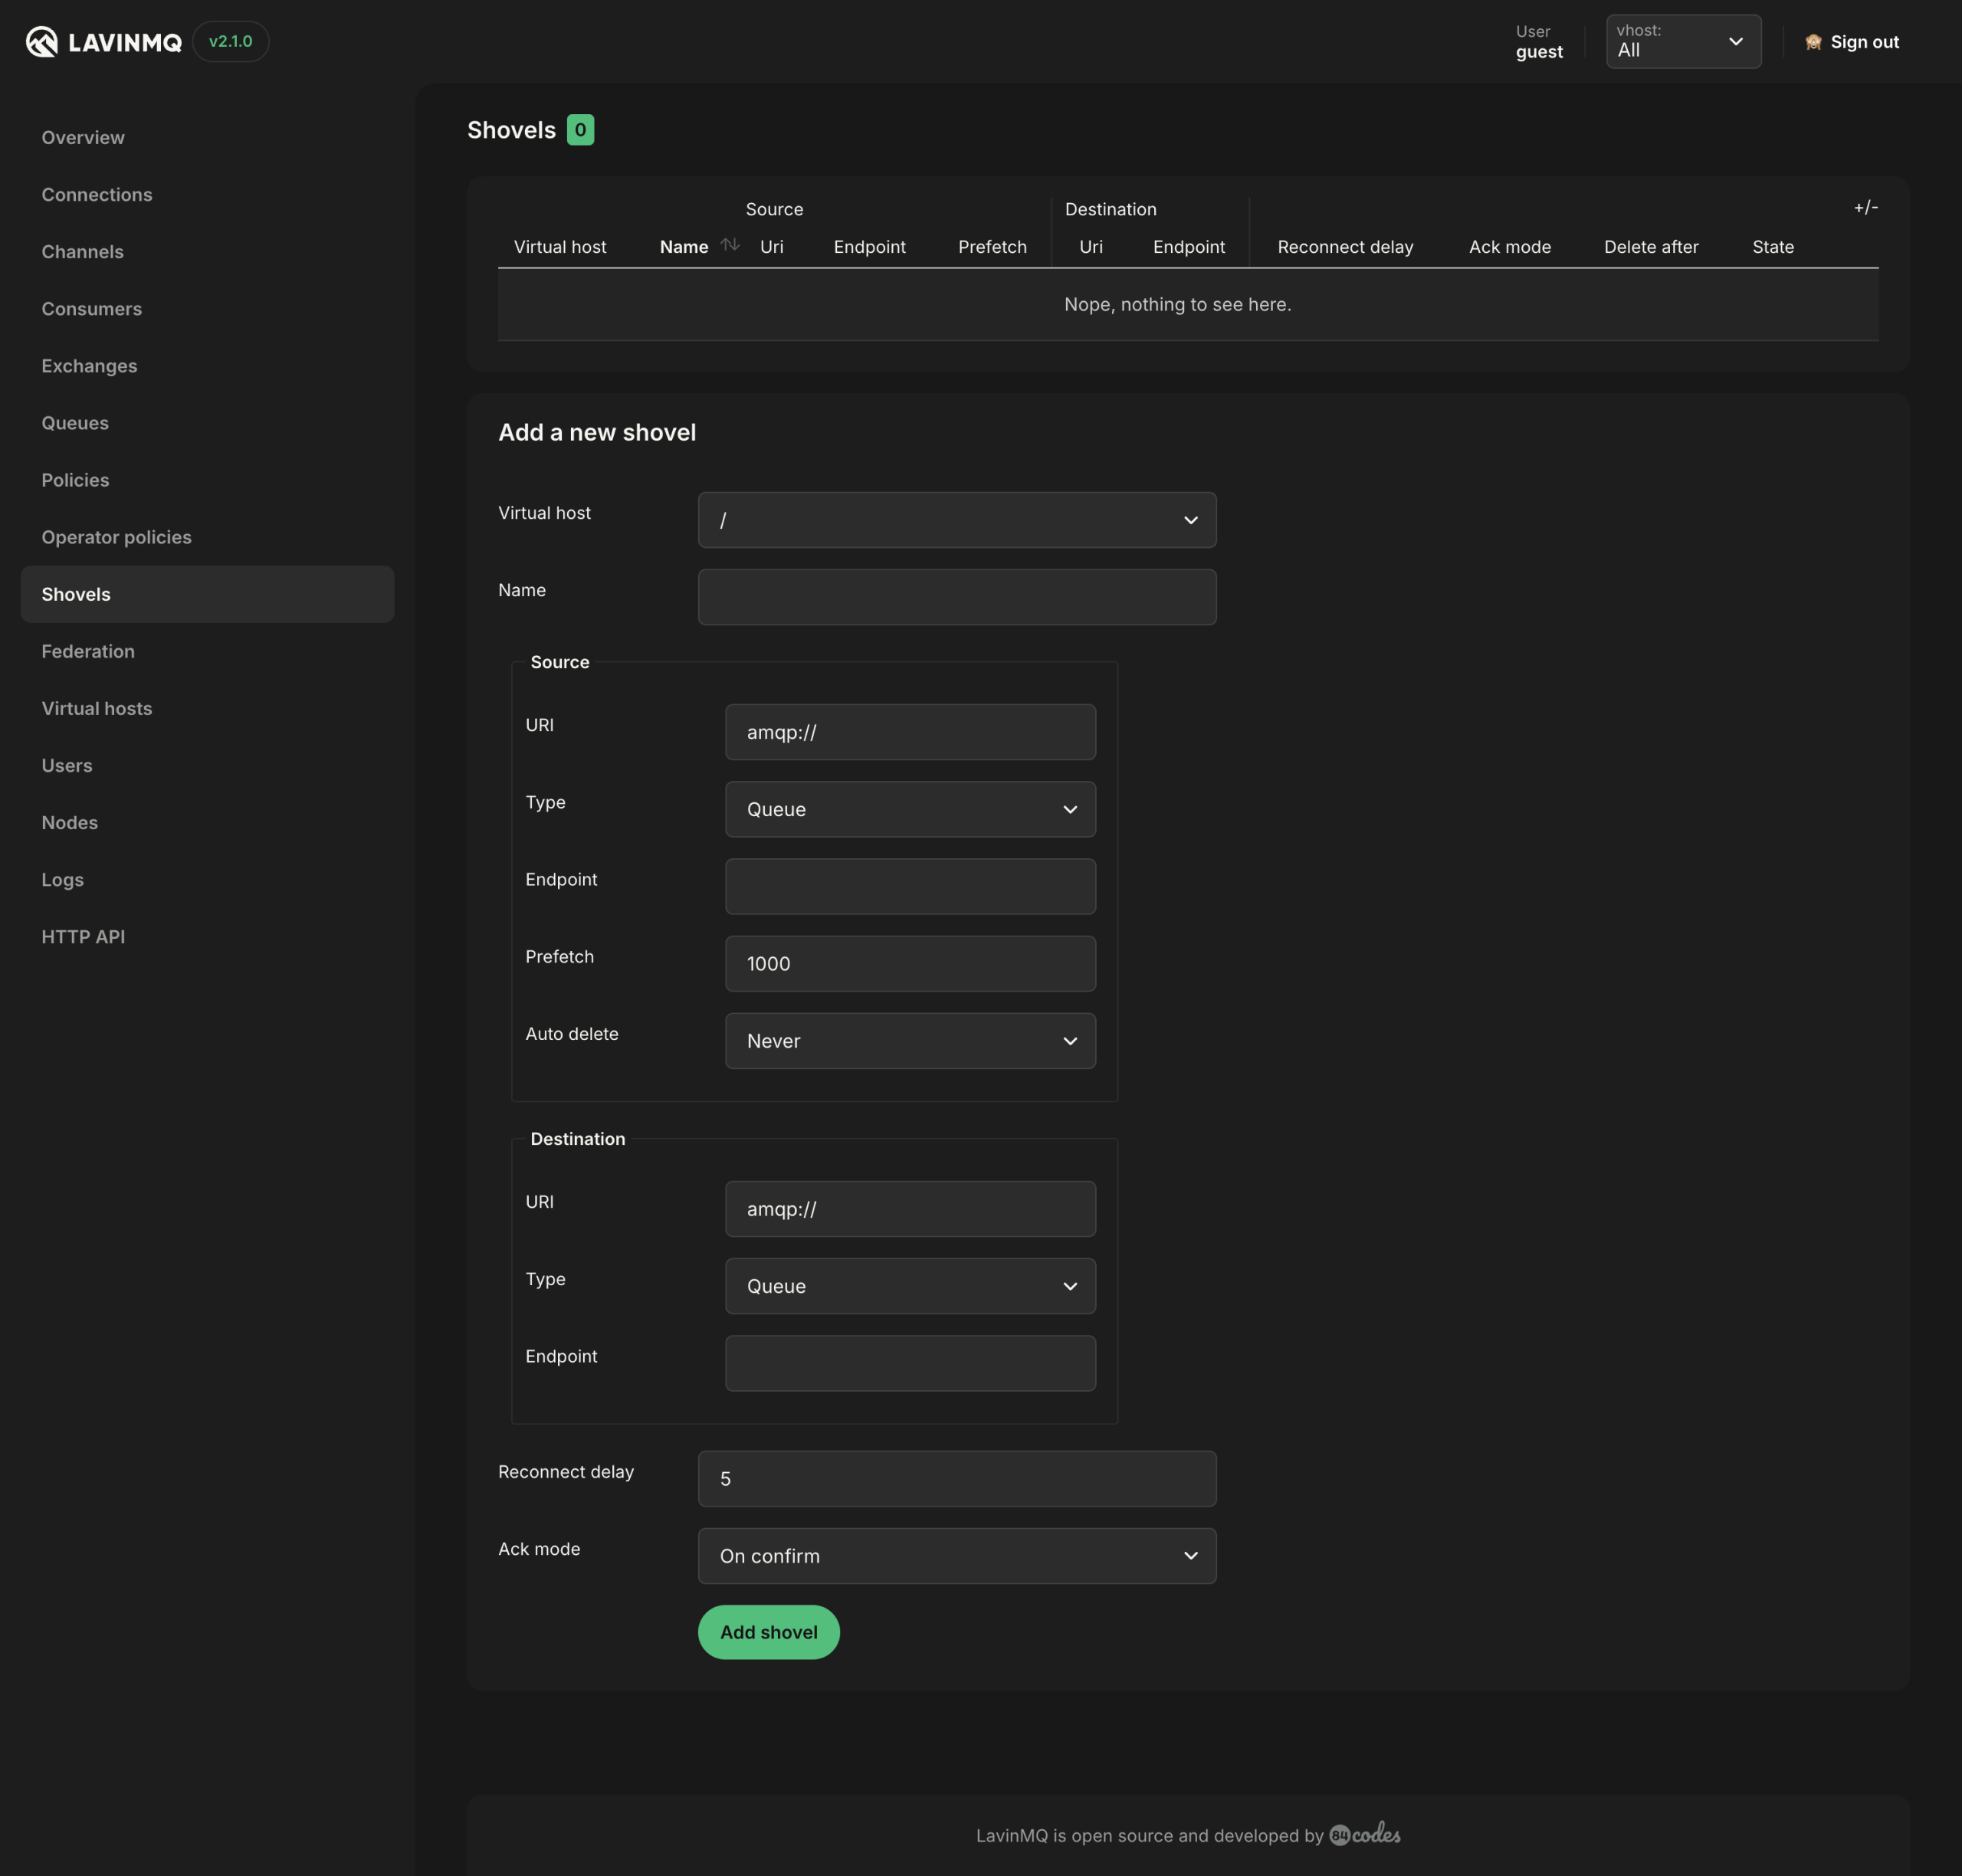
The shovels tab shows a detailed view of all shovels created and has an option to create new shovels. Shovels are used to move messages from a source to a destination. The source and destination can be in the same broker, or between different brokers.
For more information on how to create a shovel, go to the Shovel Documentation
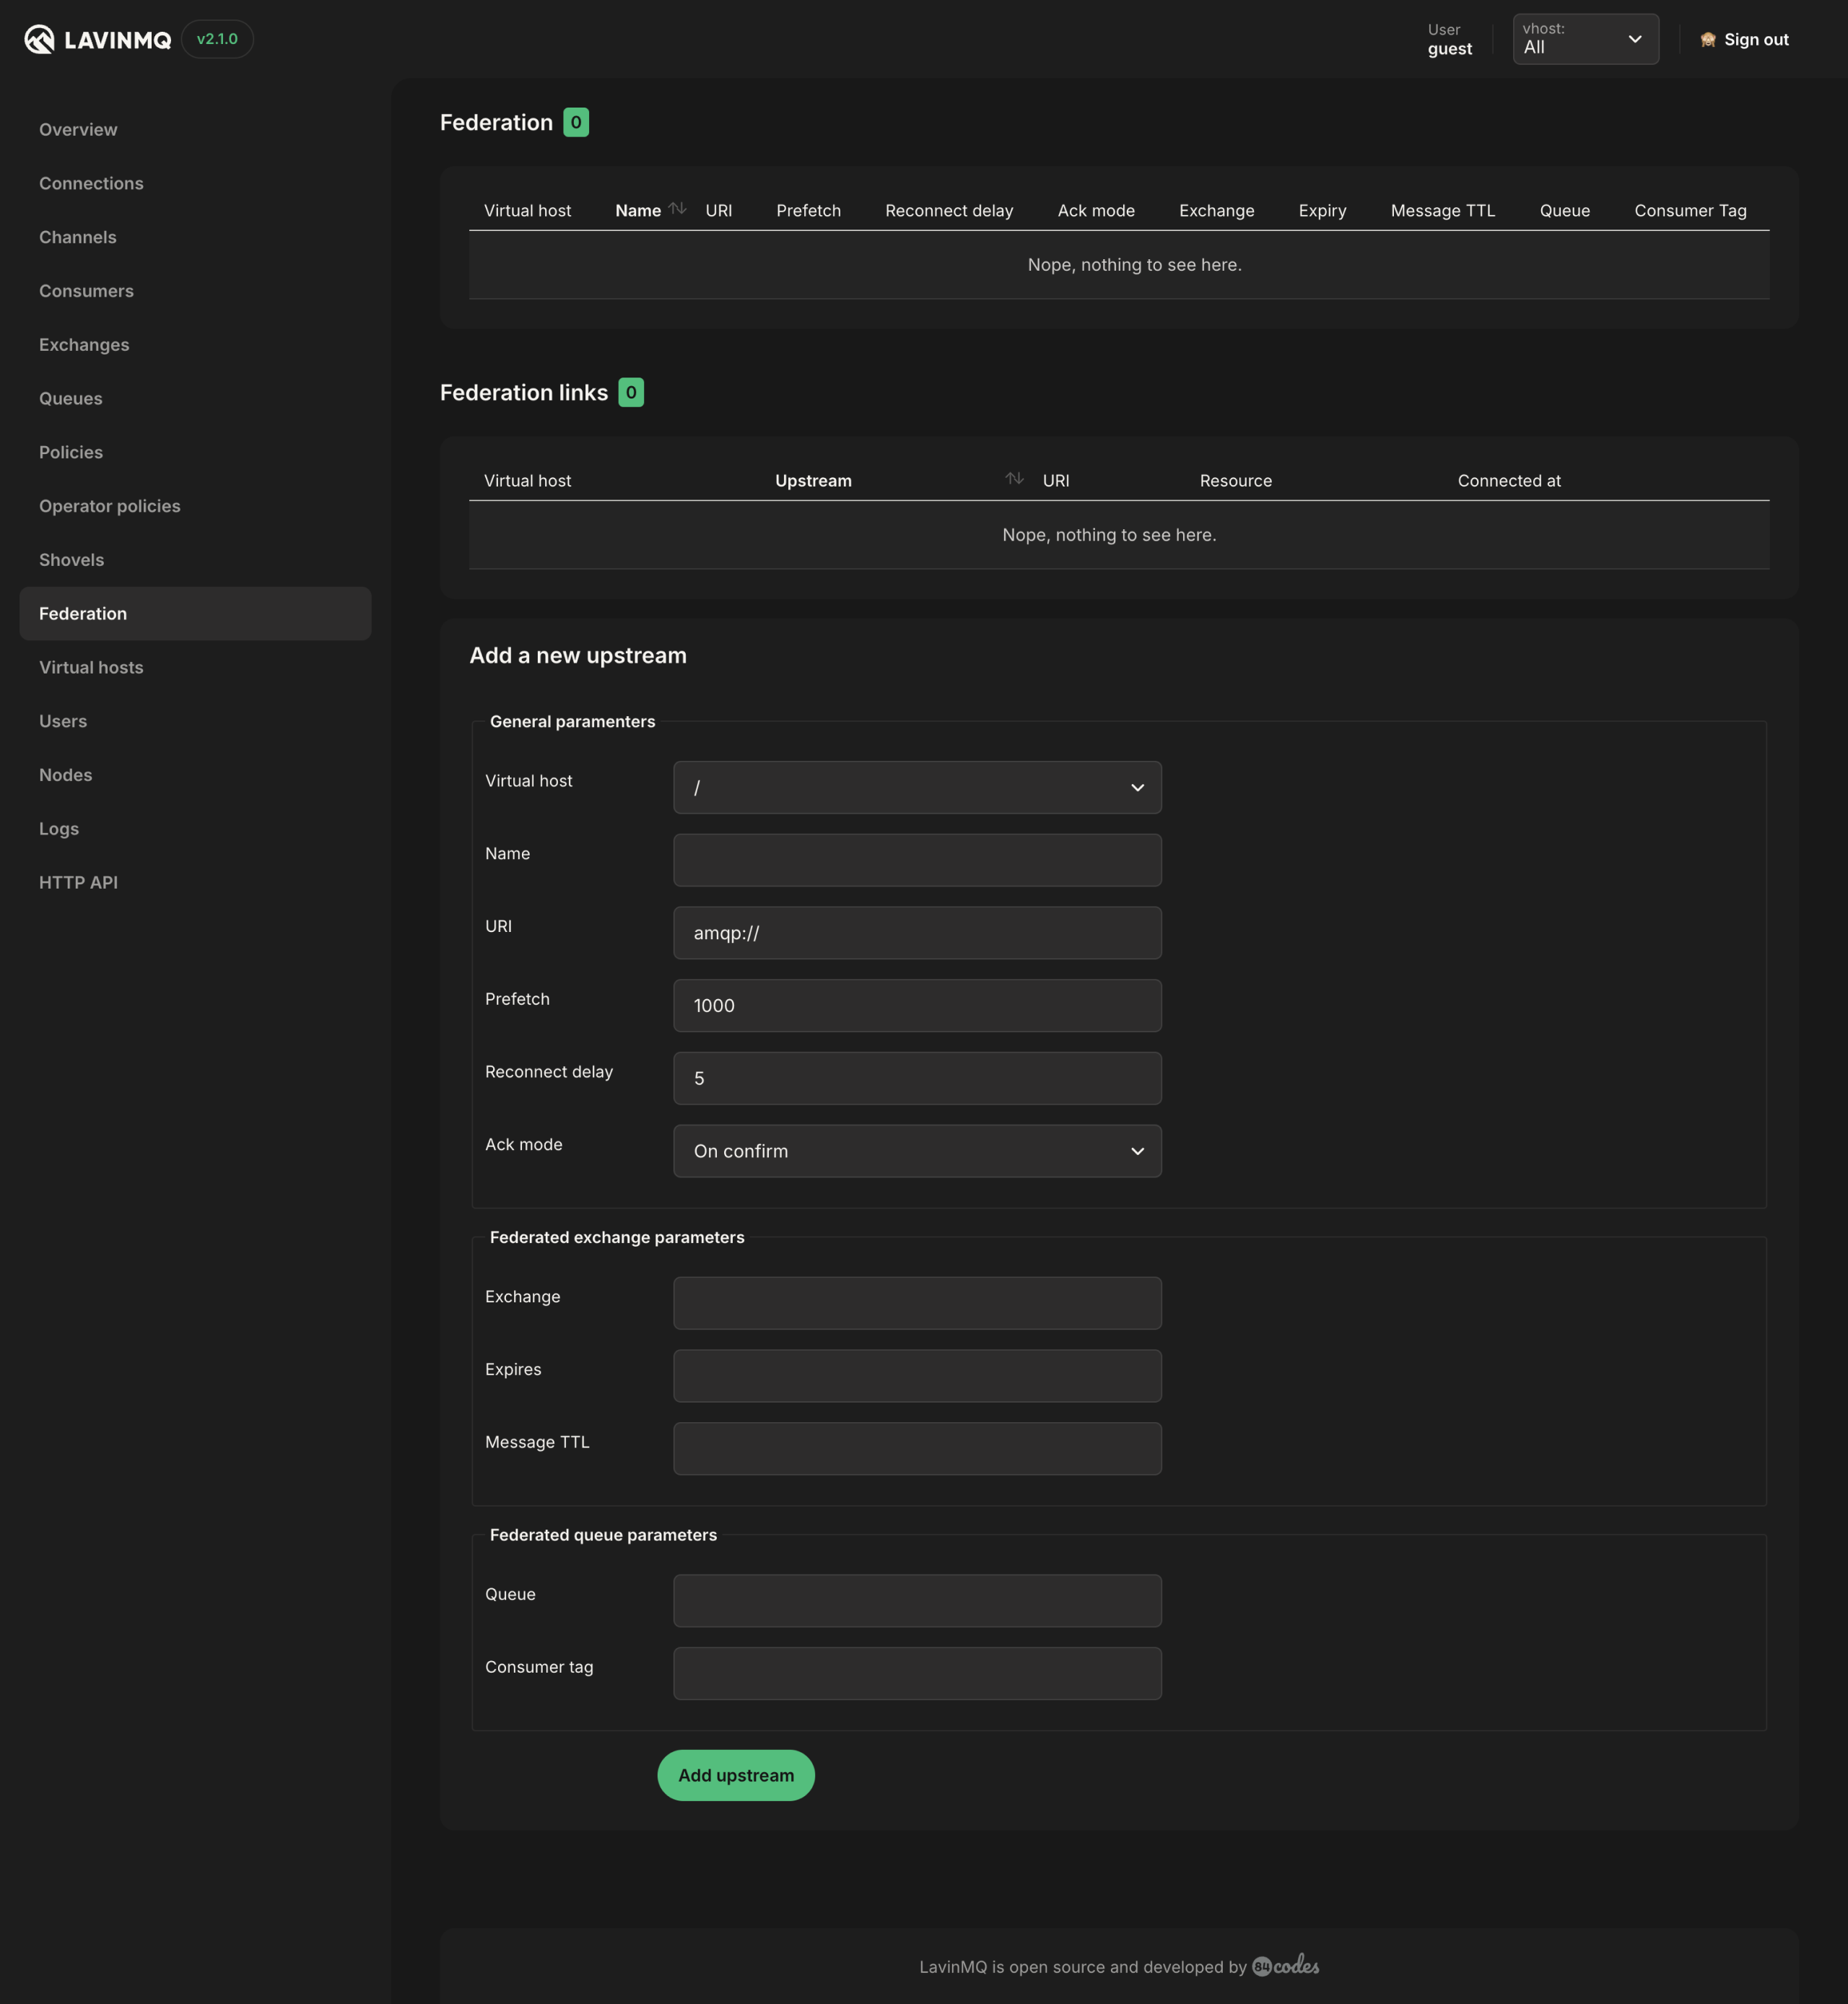
Federation
The federation tab shows a detailed view of all federations created and has an option to create new federations.
Federation is used to transfer messages between brokers. It transfers messages from one broker to another broker. There are two ways of configuring a federation, via queue federation or exchange federation.
For more information on how to create a federation, go to the Federation Documentation
HTTP API
The HTTP API is used to programmatically manage all aspects of LavinMQ. See the complete documentation for the details.
Ready to take the next steps?
Managed LavinMQ instance via CloudAMQP
LavinMQ has been built with performance and ease of use in mind - we've benchmarked a throughput of about 1,000,000 messages/sec . You can try LavinMQ without any installation hassle by creating a free instance on CloudAMQP. Signing up is a breeze.
Get started with CloudAMQP ->Help and feedback
We welcome your feedback and are eager to address any questions you may have about this piece or using LavinMQ. Join our Slack channel to connect with us directly. You can also find LavinMQ on GitHub.